Archive
Reflections on Why AI Needs to be Digitally Resilient
Geographer, oceanographer, and Esri Chief Scientist Dr Dawn Wright has written this article in ArcNews about why Artificial Intelligence (AI) needs to be digitally resilient. Because Dr Wright discusses the data implications of AI, this article has great relevance to the readers of the Spatial Reserves GIS data blog. ”As we build and use GeoAI, we must consider who is training it. Who is building the user interfaces and for what kinds of users,” states Dr Wright at the outset, which touches on our oft-mentioned theme in this blog about “know your data”.
What does Dr Wright mean by digital resilience? ”Resilience is the ability to deal with change and threats; to absorb disturbance, stress, and catastrophe; and to recover quickly from challenges and return to a desired state. We often hear about the necessity of environmental and climate resilience for our survival on Earth, considering the effects of people’s influence on the atmosphere, biosphere, and geosphere. However, digital resilience is also a key factor.”
In the article, Dr Wright identifies and describes 5 principles of digital resilience: 1. Making data and code “available” is not enough. ”We need to be transparent about what we are doing with our data and our code, including how it was trained as part of a GeoAI model. Transparency can be achieved by sharing the workflows done with the data in a “virtuous chain” or “virtuous cycle.” ]
2. Integrate via interoperability. To ensure digital resilience, we as a GIS community must foster interoperability by utilizing tools that can be translated into other formats. This means that geospatial data is findable when described by rich and accurate metadata, accessible when shared in a multitude of machine-readable formats, interoperable when easily published and shared using international open data standards, and reusable when released with clear and accessible data usage licenses.
3. Ease leads to exposure, and exposure leads to adoption. Certainly the ease of use of much in the modern GIS toolkit has increased its exposure and adoption. Adoption brings some concerns, however, in misuse and misinterpretation which we have written about extensively in this blog (including: Everyone is now a data producer).
4. Consider ethics, empathy, equity, and explainability. “Developers of responsible GeoAI must also consider equity issues such as the use of geospatial technologies for social justice and democratizing access to these technologies.” Search the Spatial Reserves blog on the right side of this blog interface for the term “ethics” and “AI” to read more about ethics as related to GIS and AI that we have recently written.
5. Promote a culture of sharing, engagement, and collaboration.
Dr Wright includes a pertinent set of “to learn more” resources at the conclusion of the article. I look forward to reading your reactions to this article.

–Joseph Kerski
Climate Trace is latest independent data viewer and portal
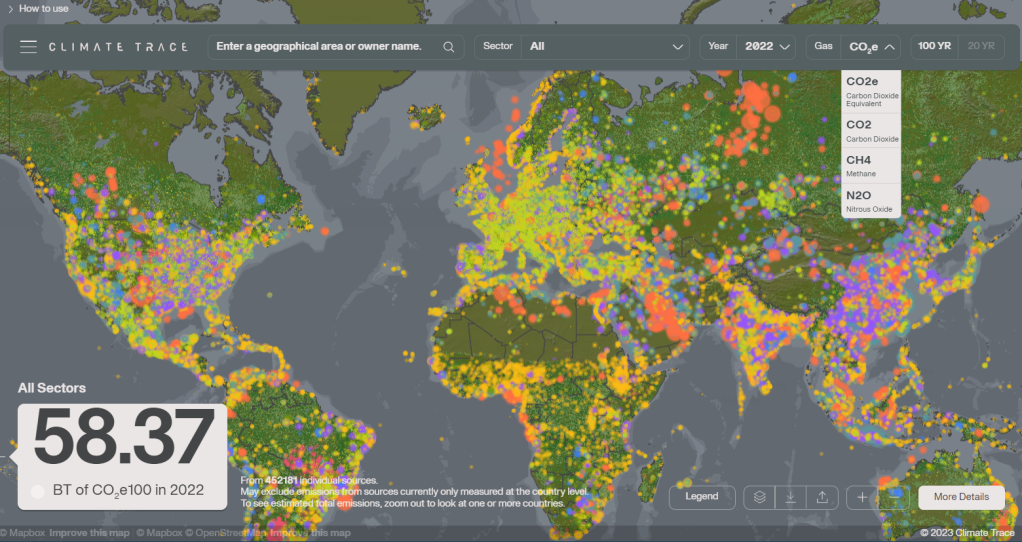
The Climate Trace portal represents one of the latest independent 2D and 3D data viewers and data libraries. Recently, it published an updated inventory at fine granularity that pinpoints nearly every major source of greenhouse gas (GHG) emissions around the world and provides independently produced estimates of how much each emits. Encompassing human-caused emissions from facilities — including power plants, steel mills, ships, and oil refineries — and other emitting activities — including fertilizer application, deforestation, and wildfires — Climate TRACE’s expanded database now tracks GHG emissions from more than 352 million assets, a 4,400x increase compared to the number of assets covered by the inventory in 2022.
Climate TRACE emissions data is free and publicly available for download and via its API. Each download package includes annual country-level emissions by sector and by greenhouse gas from 2015-2022, the applicable inventory of emissions sources, emissions source ownership, confidence and uncertainty data where available. This is the simplest way to access Climate TRACE data in bulk and is the ideal choice for most people. Gases covered include carbon dioxide, methane, and nitrous oxide.
The question, “Where did the data come from?” has for over 10 years been central to this job and an important question for ANY GIS analyst to ask. The site says, “Derived from satellites, other forms of remote sensing, and additional public and commercial data.” The site also states, “Climate TRACE is a non-profit coalition of organizations building a timely, open, and accessible inventory of exactly where greenhouse gas emissions are coming from.” As we are always stating on this blog, check your sources carefully, but this data set may be extremely useful to many and is another manifestation of the big data movement, where independent groups of a combination of government, nonprofit, academic, and private industry leaders gather together to produce a resource of wide interest and on a very important topic.
–Joseph Kerski
Explore the world with the new Landsat Explorer
The Esri Landsat Explorer app (https://livingatlas.arcgis.com/landsatexplorer) from Esri has been re-released, updated, and improved. Because this is such an amazing tool and data set, we have written about the Landsat Explorer several times in the past on the Spatial Reserves data blog, such as here, but good news! The Landsat Explorer has been recently upgraded with a new interface and with new data. With it, you can instantly analyze more than 500,000 Landsat 8 and Global Land Survey (GLS) orthorectified, cloud-minimized scenes, offering global coverage with over 500 new scenes added every day and extending back in time to the 1970s. The app is free, easy to use, and requires no download or installation required. It offers:
- Visual exploration of a dynamic global mosaic of the best available Landsat scenes.
- On-the-fly multispectral band combinations and indices for visualization and analysis.
- Interactive Find a Scene by location, sensor, time, and cloud cover.
- Visual change over time with Swipe and Animation modes.
- Spectral analysis for vegetation, water, land surface temperature, and more.
To discover more, read these short essays by my colleagues: https://www.esri.com/arcgis-blog/products/imagery/imagery/check-out-esris-new-landsat-explorer-web-app/ and https://www.esri.com/about/newsroom/announcements/esri-releases-new-landsat-satellite-data-app-to-view-and-analyze-land-changes/.
You can even toggle to the equally amazing Sentinel-2 Land Cover Explorer in this app.
I find the new version of the Landsat Explorer the best one yet. It was for years already one of my favorite apps to teach with and learn from, but now it is even easier to create a swipe showing 2 different time periods, animate the change, and render the imagery in different ways, for example, to see the Richat “eye of Mauritania” in the dynamic renderer, go here in the app:
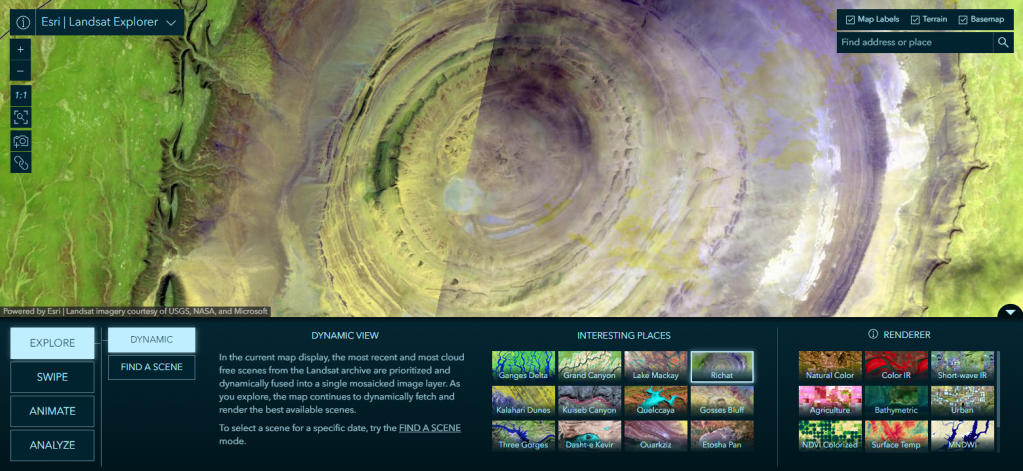
Educators can use the tool to teach about, and students and learners of all ages can use the tool to learn about: Natural hazards, volcanism, coastal process, population growth and decline, river dynamics (sedimentation, deltas, meanders, oxbow lakes), agricultural practices, transportation arteries, lake and ocean depth, de-vegetation and revegetation, and more. I have used the former iterations of this app in secondary schools, community, technical, and tribal colleges, and in universities. I also use its “interesting places” and also local places for my general public talks and keynote addresses. The app can be used in a wide variety of disciplines including physical and cultural geography, biology, natural hazards, climatology, agriculture, and even in political science (what is the land use like along borders?), archaeology, urban planning, and more.
The app’s imagery layers from Landsat can be effectively used in remote sensing and GIS courses. The same imagery layers can be brought into ArcGIS Online and ArcGIS Pro for further analysis. In addition, it is a well-designed app that can be effectively showcased when instructors ask students to create their own apps in ArcGIS (using Instant Apps, or Experience Builder), considering the tools, audience, content, and purpose of those apps.
–Joseph Kerski
Is Everyone a Geographer? Data users as data producers
I have written an essay entitled “Is Everyone a Geographer?”
https://community.esri.com/t5/education-blog/is-everyone-a-geographer/ba-p/892500
In addition, my colleague Barbaree Duke and I included this topic in our recent article, Geography in Everyday Life, in Directions Magazine, here:
I pose this question to the readers of this Spatial Reserves blog because it has direct ties to our book “The GIS Guide to Public Domain Data.” In the Public Domain Data book, we discuss the implications that crowdsourcing has had on the availability, formats, timeliness, and quality of spatial data, and the fundamental shifts it has caused in organizations and for individual GIS data users. Nowadays, everyone is a potential spatial data user, which is quite different from the world of even a few years ago. But even more of a radical shift is that nowadays, everyone is a potential data producer, as well. Whereas in the not too distant past, international and national agencies such as the USGS, UNEP, Ordnance Survey, local governments and authorities, universities, and non-government organizations were the only data producers, now, anyone with a smartphone can contribute data to the GIS cloud and share it so that others can use it. We are only just beginning to grapple with the effects this has had and will increasingly have on the world of GIS.
The book, pictured below, Practicing Geography, is, as the title suggests, stories about people making a positive difference in our world in their everyday jobs. These careers are interesting, diverse, and really show how geography can be applied to practical everyday decision making. I contributed a chapter with several colleagues of mine that shows how students can be engagingly taught about geography careers. The book also illustrates this notion of geography in our everyday lives, as exemplified by the career pathways described in the book.
We look forward to hearing your thoughts about this subject.
–Joseph Kerski
A list of the 100 Best GIS Blogs and Websites
A list of the 100 best GIS blogs and websites has been published, here:
https://tech.feedspot.com/gis_blogs/ [tech.feedspot.com]
As a key theme of Spatial Reserves is to be critical of any data, the title of “the top 100” should at least raise eyebrows. Whose “top”? What about others’ “top” lists? But after examining the resource, I learned about some new and useful resources, and was reminded of resources I had forgotten about. Yes, there are a few ads, but it is worth spending time with this resource and I salute its authors for doing some very good homework and research to compile it.
Or — was the list auto-generated? Again in keeping with the theme of our data blog about being critical of the data, note that GIS Lounge is listed, but GIS Lounge ceased in November 2023 (!), when it merged with Geography Realm. To find out more about Feedspot, see this page: https://feedspot.uservoice.com/knowledgebase/topics/53870-about-feedspot
Despite all of this, I was glad to see our own Spatial Reserves listed ! (#63)

We look forward to hearing what new resource you learned about in this list.
—Joseph Kerski
Rethinking how GIS users work with data: Spatial Analytics in Microsoft Fabric
Microsoft Fabric is Microsoft and Azure Data’s new unified data analytics platform, responsible for gathering a range of data toolsets (some of which already exist in the Azure product set) under a single umbrella. This article asks data users to “think of it as a single solution to crunch numbers and deliver insights.” The goal of Microsoft Fabric is to enable business and data professionals to unlock the potential of their data for the era of Artificial Intelligence (AI). Fabric has been revolutionizing the way data is interpreted and has been making analytics accessible to everyone, not just those with deep expertise. Microsoft Fabric covers everything from data movement to data science, real-time analytics, and business intelligence, and brings it all to a SaaS foundation, “OneLake”.
Why should this matter to the readers of this blog? Increasingly, the needs of data analysts extend beyond the traditional ways of gathering and analyzing data in a GIS environment. Recently, Esri and Microsoft announced that they have combined expertise by integrating spatial insights into Microsoft Fabric. Within Fabric’s unified analytics platform, analysts will have access to a range of reliable spatial functions and tools that reveal spatial patterns and trends. They will be able to seamlessly deliver results into Microsoft 365 and across the Fabric environment. They can conduct deeper exploration by using interactive mapping capabilities and software as a service (SaaS) offerings in Esri’s ArcGIS technology stack.
In Fabric, a unified collection and coordination of data assets will pair sophisticated spatial analysis tools with an intuitive UI/UX, including the following:
- The ability to perform visual analytics within the context of location
- 140+ spatial functions and tools (as of December 2023)
- Native integration with Power BI and M365 apps
- An interactive mapping experience via ArcGIS
- A unified platform to share and access your organization’s data
For more information, see: https://www.esri.com/en-us/c/product/spatial-analytics-in-microsoft-fabric.

These developments merit attention and will no doubt transform the way data analysts interact with GIS tools, and also impact the volume and variety of data that can be analyzed.
–Joseph Kerski
Exploring the Colorado Geospatial Portal
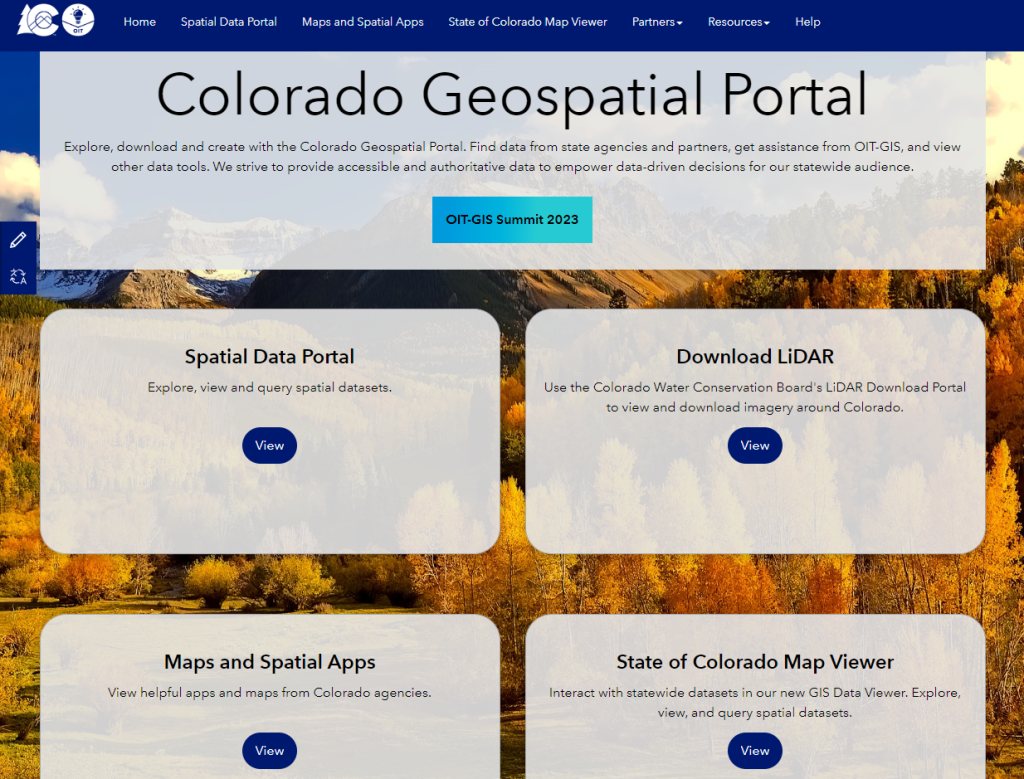
The Colorado Geospatial Portal (https://geodata.colorado.gov/) allows both trained GIS professionals and members of the general public to discover geospatial technology across the state. The site includes a spatial data portal, a map viewer to visualize various datasets, links to state and federal geospatial partners, and open resources such as trainings. The goal of the site is to provide a centralized location for all GIS users to find data, explore applications, or find contacts for their own purposes. As a longtime resident of Colorado, I can attest to the vibrancy of the GIS community here. This portal is indeed what many of us have been dreaming about for years; therefore I salute Jackie Phipps Montes, our state of Colorado GIO, and her team. Jackie says the following:
“The Spatial Data Portal aims to provide accessible and authoritative data to drive decision-making statewide. Previously, geospatial data could be found across 14 different locations such as the Colorado Information Marketplace (CIM) or individual agency websites. However, these methods either have limited geospatial functionality or rely on the end user to understand the agency structure across the state. The Spatial Data Portal tries to remove this barrier. We work with our agency partners to pull their data, maps, applications, and links to their geospatial resources. The result is one place to discover the numerous resources across the state.”
“These efforts aim to make geospatial more discoverable for a wide audience. We want our geospatial technologies, data, and resources to fully embrace the Digital Equity, Literacy, and Inclusion Initiative. The Governor’s Office of Information Technology will continue curating content for the Spatial Data Portal striving to provide relevant data, consistent sources, and to provide resources to make navigating and using geospatial technology and data easier in the State of Colorado.”


I look forward to your reactions and how you are using the portal!
—Joseph Kerski
Modern strategies for finding geospatial data updated
Our guidelines about “modern strategies for finding geospatial data” has just been updated. Why? To keep it modern! GIS portals, tools, the open data movement, and societal expectations continue to evolve; hence, the need to update this essay. This essay serves as a guideline and a short course that you could take yourself, teach others, or share with colleagues. Updates include videos that were recorded while one of us taught a recent workshop on this topic, and also a section on using ChatGPT to find data!
I recently taught a course with the content described in this essay. The course is available in video form, here:
Part 1: https://youtu.be/eBEWQRFYQBE?si=YwkLGw7TWUyIgjfO
Part 2: https://youtu.be/UyG7TEdSv8I?si=UCSflXx16Om-zRhM
Part 3: https://youtu.be/JDH8LP5Vy1Y?si=GcaK3cVGEe7I92my
Part 4: https://youtu.be/XSCCq-IrYyY?si=ZSRekabrhCbftkVZ

–Joseph Kerski
Data Pipelines: A new tool to import data from 3rd Party APIs, AWS, CSVs, and more
In June 2023, ArcGIS Online released with a new data integration capability, Data Pipelines. This application, currently in beta, provides a workbench User Interface to import and clean data from cloud data stores, such as AWS and Snowflake, read files such as CSVs, GeoJSON, and other formats. Once you have connected to your data, you can engineer the data to a desired state and then write the data out to a feature layer. This new feature in ArcGIS Online is central to the themes of this Spatial Reserves data blog and I trust will be of interest to our readers.
According to my colleague’s post linked here, you can:
- Connect to datasets in your external data stores, like Amazon S3 or Snowflake.
- Ingest public data that is accessible via URL, such as datasets found in open data portals or a downloadable CSV provided by your local government.
- Filter and clean your data using data processing tools, like Filter by attribute, Select fields, and Remove duplicates.
- Enhance your data by joining it with information from Living Atlas layers using the Join tool, or use Arcade functions to calculate field values using the Calculate field tool.
- Easily integrate and clean data in ArcGIS Online with an easy-to-use drag-and-drop interface
- Create reproducible, no-code data prep workflows.
As illustrated recently by my colleague Brian Baldwin, shown here, Brian pointed to the New York City 311 data set hosted on their Open Data platform, and built out a layer from it in about 2 minutes. Instead of the typical workflow from an open data site where you would have to export the data and/or have to build a Python script to do so, Brian created a data pipeline that could automatically bring the data in and even be run on a recurring schedule to keep the data up to date.
To engage the tool, in ArcGIS Online, go to the app launcher (the icon that looks like a 3×3 set of dots in the upper right of the ArcGIS Online interface), and select and launch Data Pipelines. Then, create your first data pipeline. The User Interface provides a blank canvas where you construct elements in a data model that tells the app what you want to do with the data. You would then need to, in the UI, provide the:
- Inputs–These are the connections to data sources used to read in the data you want to prepare. You can add one or multiple inputs to build your workflow. A full list of supported inputs can be found here.
- Tools–Once you’re connected to your data, you can configure tools to prepare and transform your data. For example, you can filter for certain records using queries, integrate datasets by using joins, merge multiples datasets together, or calculate a geometry field to enable location. A full list of the available tools can be found here.
- Outputs–Once your data is prepared, it can be written to feature layers. You can create a new feature layer or update existing feature layers. For more detailed information on configuring data pipeline outputs, see the output feature layer documentation.
Here is what the UI looks like. The drag and drop user experience reminds me of using Model Builder in ArcGIS Pro. On an instructional note, I believe this type of diagram and flow between the graphics fosters spatial thinking as well as GIS skills.
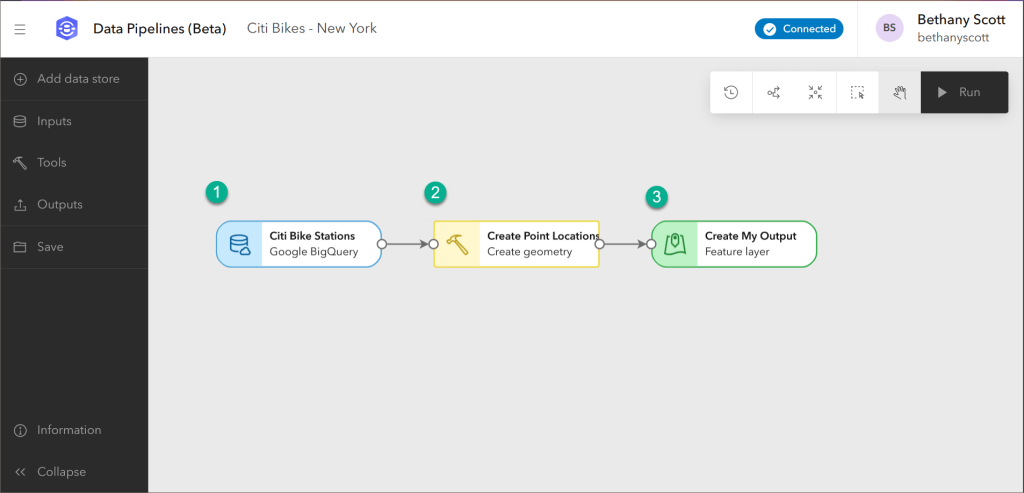
A view of data pipelines in use.
In the introductory blog, you can watch an introductory video. Once you are ready to get started, you can create your first data pipeline via this tutorial. The Esri Community on Data Pipelines is another great place to learn more.
I look forward to using this tool and to hearing your reactions to it.
–Joseph Kerski
Exploring National Data Hubs
National data hubs provide data about a nation’s people, place, and economy. National portals and libraries are intended to help users gain access to basic information to keep users well informed and assist in good policy and decision making. Of interest to the readers of this blog is that increasing numbers of national portals include geospatial data in their offerings.
A selected short list of these is as follows:
Ireland: https://www.geohive.ie/
Australia: https://digital.atlas.gov.au/
Burkina Faso SDG hub: https://sustainable-development-goals-bfdatahub.hub.arcgis.com/
The UAE: https://1map-fcsa.hub.arcgis.com/
Saudi Arabia SDG hub: https://www.geoportal.sa/portal/apps/sites/#/ksa-sdgs-en/ which is very newly launched.
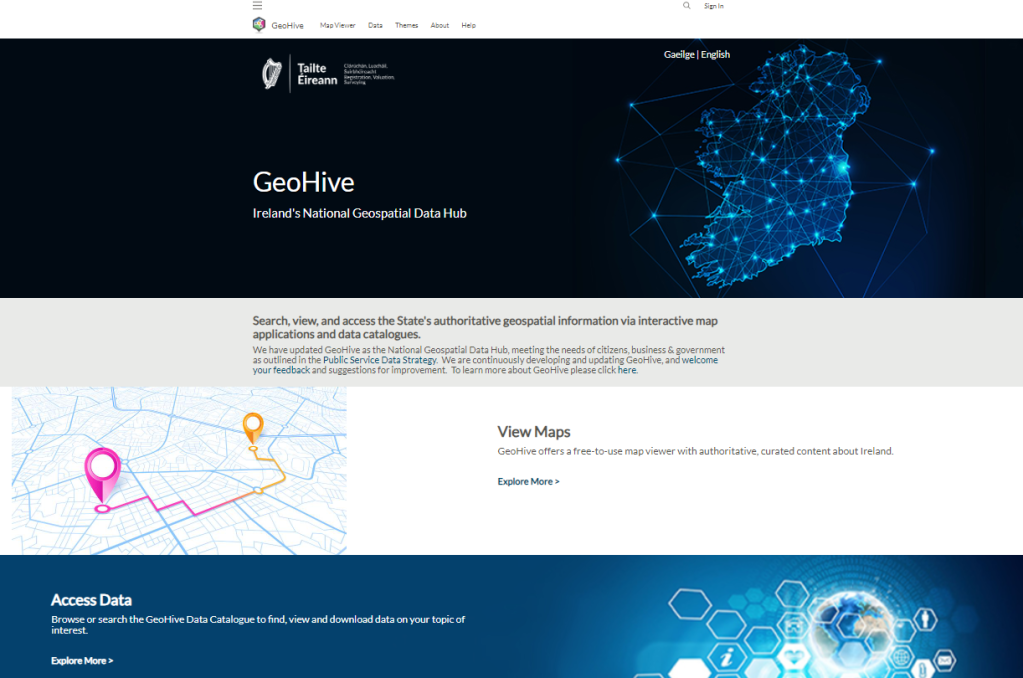
Many of the above in my opinion can be viewed as “best practice” that others could emulate for example using ArcGIS Hub’s ease-of-use and functionality. The hub sites feature data but also selected data stories–the most critical issues to {Country/ citizens e.g., Jamaicans or Kenyans} is a healthy and stable population, a prosperous economy and a healthy natural environment. Key to reaching these goals are programs focused on education, health care, social protections and initiatives to support a stable and sustainable economy as well as those focused on protecting the nation’s natural resources and unique environment. These stories connect with these issues and highlight the need to collect, compile, and communicate, so that information will be available to decision makers in a wide variety of formats, including maps and geospatial data layers.
One of the most useful features of any of these sites, which should be of interest to the readers of this data blog, is embedded web maps, often available at multiple scales.
I encourage you to investigate this resource and look forward to hearing your reactions. Some other data hubs are listed here. Do you know of other ArcGIS Hub sites or other data libraries focused on official statistics? If so, feel free to share them in the comments section.
–Joseph Kerski
Contributors
Gallery


Recent Comments