Archive
Access data and analytical tools online from EOS Data Analytics
A new platform from EOS Data Analytics (https://eos.com/platform/) allows data users not only to access data, but even perform online image processing in a web browser. It is a set of mutually integrated cloud products for searching, analyzing, storing, and visualizing geospatial data. This is a representation of what we have been discussing on this blog, namely, the increasing adoption of Software as a Service, and in addition, the combination of SaaS with data services and analytical services. Thus, GIS professionals can search for, analyze, store, and visualize large amounts of geospatial data in one platform. Doing all this in one system and also in a browser is, quite frankly, quite amazing.
With the EOS Platform, GIS users have access to an ecosystem of four mutually integrated EOS products, which together provide a powerful toolset for geospatial analysts. Image data is stored in cloud-based storage and is available for image processing or remote sensing analysis at any time; this can be a raw user file, an imagery obtained from their LandViewer data portal, or an output file from their online EOS Processing tools. The EOS Platform is currently available for free during an open Beta. The LandViewer tool has been freely available for some time and will continue to be.

There are at least two reasons why image processing is the platform’s major asset: the processing of large data amounts runs online and offers as many as 16 workflows with even more coming soon. On top of that, users can get the best cartographic features of EOS Vision for vector data visualization and soon to come, analysis.

A list of EOS Processing workflows that can be filtered by industry and input data type.
I found the LandViewer tool easy to use, with a wide variety of data sets to choose from, including Landsat, MODIS, NAIP, and others.

The LandViewer tool interface.

Choosing one’s own area of interest via the LandViewer interface.
Ordnance Survey GB to provide OS MasterMap data for free.
The UK government announced last week that key parts of the OS MasterMap dataset (OSMM) are to be made available free of charge (see full announcement from OS). The following two datasets are due to be released under the Open Government licence (OGL) agreement:
- OS MasterMap Topography Layer property extents
- OSMM Topography Layer TOIDs (TOpographic IDentifiers), built into the features in the OS OpenMap-Local dataset.
In addition, a number of datasets will be made available (through an API) for free, up to a threshold, including:
- OS MasterMap Topography Layer, including building heights and functional sites
- OS MasterMap Greenspace Layer
- OS MasterMap Highways Network
- OS MasterMap Water Network Layer
- OS Detailed Path Network
The announcement didn’t included any information on what the threshold for free access was, but no doubt details will start to filter out shortly as organisations start making use of these new data assets.
Imaging Spectrometer data from NASA AVIRIS
The NASA AVIRIS mission has generated imaging spectrometer data for many areas of the USA since the 1990s. The AVIRIS download portal for data from 2006 onward is on a node at NASA, here. The AVIRIS sensor collects data that can be used for characterization of the Earth’s surface and atmosphere from geometrically coherent spectroradiometric measurements. This data can be applied to studies in the fields of oceanography, environmental science, snow hydrology, geology, volcanology, soil and land management, atmospheric and aerosol studies, agriculture, and limnology. Applications under development include the assessment and monitoring of environmental hazards such as toxic waste, oil spills, and land/air/water pollution. With proper calibration and correction for atmospheric effects, the measurements can be converted to ground reflectance data which can then be used for quantitative characterization of surface features. In short, AVIRIS can collect in over 200 bands and therefore it can help analysts work out details such as vegetation health, or even species type, from the data.
The AVIRIS portal, presented in a Google map with popups with download links, as well as the metadata file (in plain text format, available here) both look very dated. But this is a case where we encourage the user to give it a try–the portal may not look modern, but the data behind the portal is incredibly useful. One can toggle data layers in the right hand corner of map to show All AVIRIS data or the Attrib. Filtered data (data that meets the attribute criteria but ignores the spatial filter). One can also bound a box on the map, which has long been a favorite feature of mine on data portals, using the red rectangle to activate. To update the spatial filter, click the “Update Map” button below the map. The files are not streamed, but must be downloaded; perhaps because of their large size (typically over 1 GB). Again, think “old school” formats – zip files and TAR files, but again, the data are plentiful and useful. A set of previews are available, for example, here, and shown below. For more information about AVIRIS data, see this link and this link.
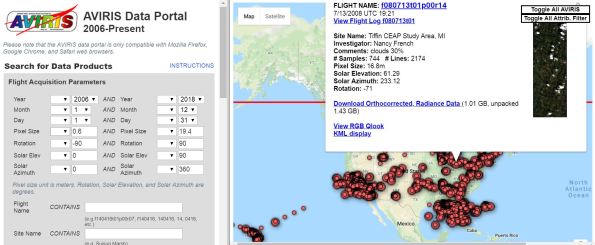
The AVIRIS data portal.
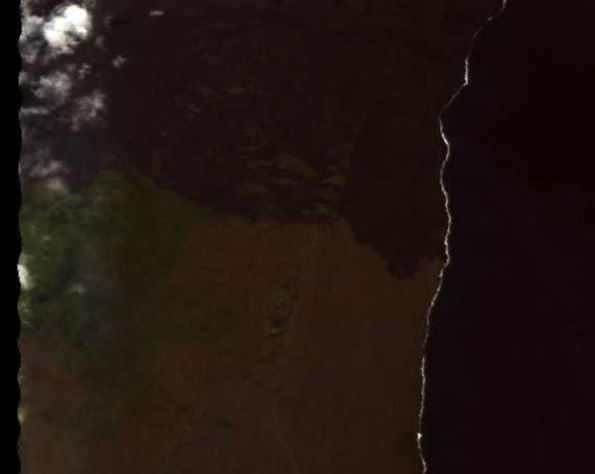
A sample AVIRIS image.
Contributors
Gallery


Recent Comments