Archive
On Reputation and Geospatial Information
An interesting article appeared this year entitled “Say goodbye to the information age, it’s all about reputation now” in which Gloria Origgi , philosopher and senior researcher, states that “We are experiencing a fundamental paradigm shift in our relationship to knowledge. From the ‘information age’, we are moving towards the ‘reputation age’, in which information will have value only if it is already filtered, evaluated and commented upon by others. Seen in this light, reputation has become a central pillar of collective intelligence today.”
This observation struck me as in some ways obvious–we are increasingly being asked, and increasingly volunteer, our opinions on everything from what we’ve purchased to where we ate out last to our last airline flight. And we increasingly base our own decisions on how a product or service is evaluated by others. It is my observation that this deluge in surveys and opinion polls makes it more challenging for those of us in the research community to get responses for our own surveys.
But more importantly, in the GIS world, reputation is becoming another part of metadata, influencing our decision whether or not, and how, to use a particular data item. Does the number of “views” that a certain data item has had in a web GIS platform such as ArcGIS Online influence your decision? Should it? Along these lines, Gloria goes on to say that “Whenever we are at the point of accepting or rejecting new information, we should ask ourselves: Where does it come from? Does the source have a good reputation? Who are the authorities who believe it? What are my reasons for deferring to these authorities?” I regularly encourage my students and colleagues to pay attention to the profile, or identification, of a data producer in ArcGIS Online or in any cloud based, crowd-sourced library. If a data set looks rigorous and complete, but the author has not even bothered to change the “head and shoulders” outline or to populate the least bit of information about themselves, it casts doubt on whether I should trust that data set.
But Gloria’s observation also struck me as somewhat disturbing, because it touches on some core themes that we have been writing about in this blog for many years now: How can we trust a geospatial data set, particularly in our web-based GIS environment? In the days of “authoritative sources only”, when all we had to choose from was TIGER, Landsat, EOSAT, DLG, Land Use Land Cover, DEMs, digital orthophotos, and some other core data sets from mapping and statistical agencies, we still needed to evaluate data sources, lineage, quality, scale, date, methods, and other attributes, but making decisions has become more complex with modern web-based GIS libraries. The reason is partly because we have much more data at our fingertips, much of it being crowdsourced. But the situation is more complex I believe because the expectation that data searching should be easy nowadays, because there is “so much out there,” and consequently, analysts feel pressure to keep the data access and manipulation part of a GIS project as short as possible, with perhaps too little attention on wise choices about data.
Another reason this makes me uneasy is, what happens if we are only paying attention to who likes a data set or who has viewed a data set, and paying less attention to other measures? Just because a song is popular does not mean it is “good” according to one’s own measure of music quality. And just because a data set is popular does not mean it is the best representation of a phenomenon one is seeking to understand. A less popular data set might be the most suitable.
What are your reactions to the impact that reputation and popularity are having or could have on the field of GIS?
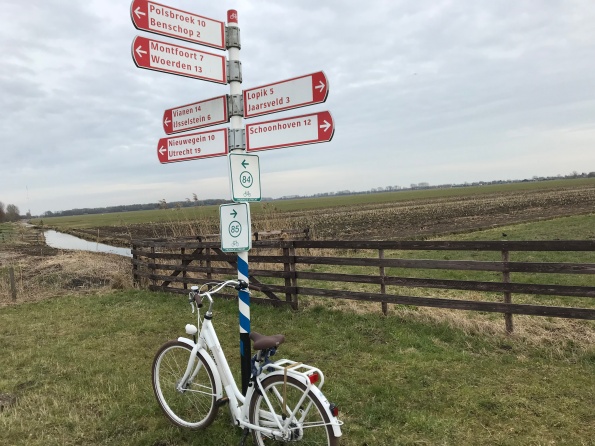
Decisions, decisions… To what extent do we or should we use reputation and popularity in our choices of data to use?
Using Kaggle big data in a GIS
Kaggle is a platform for predictive modelling and analytics competitions in which statisticians and data miners compete to produce the best models for predicting and describing the datasets uploaded by companies and users. This crowdsourcing approach relies on the fact that there are countless strategies that can be applied to any predictive modelling task and it is impossible to know beforehand which technique or analyst will be most effective. [Wikipedia]. Over a half million people are in the Kaggle community, from nearly every country in the world. Kaggle was acquired by Google a few years ago. You can also learn about R, SQL, machine learning, and other topics on the site. Why mention Kaggle in our geospatial data blog? Kaggle hosts data sets on their site, some of which are spatial in nature, and some of which are truly “big data” (such as 9 million open images URLs), and as such, it represents a source of information for the GIS analyst, researcher, and instructor.
Because the data posted to Kaggle comes from a global community with diverse interests, expect an unusual array of data sets, from chest x-rays, superheroes, air quality, to birdsongs. Some data are from surveys. Many intriguing gems exist; for example, one of the data sets of interest to me as a geographer on the Kaggle site is the world happiness data . It is available as a CSV for three different years. The only unfortunate aspect of these tables is the lack of a country code; and relying only on name of country could present problems in joining the data to a map.
One can also learn about data sources by spending time on the Kaggle site. For example, I learned about Uber Movement that contains data from selected cities and points of departure, Sports Reference that someone used to scrape 120 years of Olympic history data from, and a cancer imaging archive that someone used to obtain disease type and location. Given the nature of the site, expect all sorts of oddities: My search on mountains of the world resulted in lots of “404 Not Found” errors; some data is documented and others not so much; and obtaining some of the data requires the user to be a programmer. Still, Kaggle is a useful and unusual source worthy of attention, and given the rapid evolution in big data and crowdsourcing, as we frequently write about on this blog, I expect that we will be seeing many more sites like this in the future.
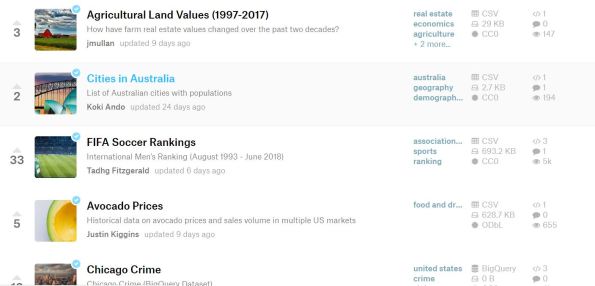
A section of the Kaggle listing of data sets, showing the diversity of themes, scales, and sizes.
Historical Imagery for the entire world now available via Wayback Service in ArcGIS from Esri
I know that many of you regularly want to examine changes-over-space-and-time with imagery and GIS for research or instruction purposes. As of last week, 81 different dates of historical imagery for the past 5 years now reside in ArcGIS via the World Imagery Wayback service. For more information, see: https://www.esri.com/arcgis-blog/products/arcgis-living-atlas/imagery/wayback-81-flavors-of-world-imagery/
You can access this imagery in ArcGIS Online, ArcMap, and ArcGIS Pro. A great place to start is the World Imagery Wayback app – just by using a web browser – https://livingatlas.arcgis.com/wayback/ A fascinating and an incredible resource for examining land use and land cover change, changes in water levels of reservoirs, coastal erosion, deforestation, regrowth, urbanization, and much more. This resource covers the entire globe.
However, in keeping with the theme of our book The GIS Guide to Public Domain Data and this blog of being critical of the data, caution is needed. The dates represent the update of the Esri World Imagery service. This service is fed by multiple sources, private and public, from local and global sources. Thus, the date does not mean that every location that you examine on the image is current as of that date. I verified this in several locations where my ground observations in my local area show construction as of June 2018, for example, but that construction does not appear on the image. In addition, several other places I examined from wintertime in the Northern Hemisphere were clearly “leaf-on” and taken during the summer before, or even from the summer before that. Therefore, as always, know what you are working with. Despite these cautions, the imagery still represents an amazing and useful resource.
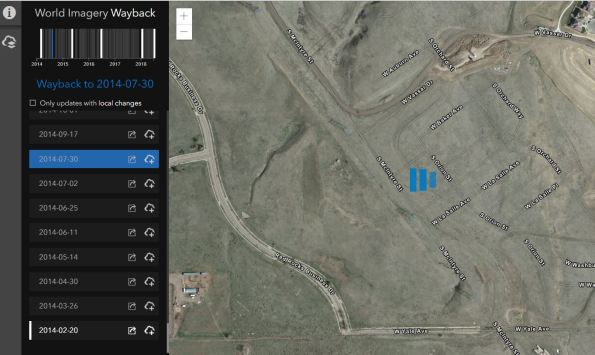
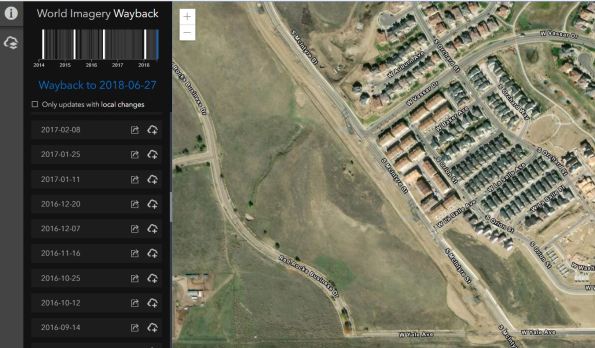
Sample from this imagery set for 30 July 2014 (top) and four years later, 27 June 2018 (bottom) for an area outside Denver, Colorado USA.
Contributors
Gallery


Recent Comments