Archive
10 New ArcGIS Pro Lesson Activities, Learn Paths, and Migration Reflections
A new set of 10 ArcGIS Pro lessons empowers GIS practitioners, instructors, and students with essential skills to find, acquire, format, and analyze public domain spatial data to make decisions. Described in this video, this set was created for 3 reasons: (1) to provide a set of analytical lessons that can be immediately used, (2) to update the original 10 lessons created by my colleague Jill Clark and I to provide a practical component to our Esri Press book The GIS Guide to Public Domain Data, and (3) to demonstrate how ArcGIS Desktop (ArcMap) lessons can be converted to Pro and to reflect upon that process. The activities can be found here. This essay is mirrored on the Esri GeoNet education blog and the reflections are below and in this video.
Summary of Lessons:
- Can be used in full, in part, or modified to suit your own needs.
- 10 lessons.
- 64 work packages. A “work package” is a set of tasks focused on solving a specific problem.
- 370 guided steps.
- 29 to 42 hours of hands-on immersion.
- Over 600 pages of content.
- 100 skills are fostered, covering GIS tools and methods, working with data, and communication.
- 40 data sources are used, covering 85 different data layers.
- Themes covered: climate, business, population, fire, floods, hurricanes, land use, sustainability, ecotourism, invasive species, oil spills, volcanoes, earthquakes, agriculture.
- Areas covered: The Globe, and also: Brazil, New Zealand, the Great Lakes of the USA, Canada, the Gulf of Mexico, Iceland, the Caribbean Sea, Kenya, Orange County California, Nebraska, Colorado, and Texas USA.
- Aimed at university-level graduate and university or community college undergraduate student. Some GIS experience is very helpful, though not absolutely required. Still, my advice is not to use these lessons for students’ first exposure to GIS, but rather, in an intermediate or advanced setting.
Why use these lessons? The lessons offer 8 unique advantages: (1) The lessons engage students by focusing on the geographic inquiry process, beginning with the problem to be solved, such as the optimal site for siting a new business in a metropolitan area, the rate and pattern of the spread of an invasive species, the ideal locations for growing tea in Kenya, assessing reservoir and dam vulnerability in the event of a hurricane, and more.
(2) While those working through the lessons build solid GIS skills (building expressions, joining data layers, intersecting, projecting, georegistering imagery), skills are not limited to “learning more GIS“. Skills in data management and communication are a prominent part of these lessons. At the end of each lesson, students are asked to communicate the results of their research in a variety of ways, including sharing to ArcGIS Online, making a short video, and creating a web mapping application such as a story map.
(3) A significant proportion of each lesson touch on accessing, formatting, projecting; i.e. developing data competencies. Helping people make wise decisions about the data, and giving them practical skills in doing so, is one of our chief goals with these lessons and the book. A balance is struck between engaging with enough data to provide a realistic scenario, but recognizing that “more is not always better.”
(4) The same lesson is available in an ArcGIS Desktop (ArcMap) format and an ArcGIS Pro format, so that those still hesitating about migrating from ArcGIS Desktop to ArcGIS Pro can use these as an example that it is not only possible, but there are many advantages to doing so.
(5) Questions posed in each lesson focus on thoughtful reflection about the data and the process, such as, “what difference would data at a different scale have on your analysis results?”, “what was the most significant thing you learned about natural hazards in this lesson?” and “if you had more time, what data set might you have also wanted to include in your analysis? Where do you think you could obtain such data?”
(6) These lessons have been tested and refined over several terms with students across many universities.
(7) An answer key is available for each lesson. But in keeping with the reflective nature of these lessons, often, there is no “single correct answer.”
(8) A lesson on building an ecotourism map in New Zealand allows students to use their gained skills in an independent project where they decide what themes to choose, what data to use, how to process it, and what problems to solve.
How to access the lessons: The ideal way to work through the lessons is in a Learn Path which bundle the readings of the book’s chapters, selected blog essays, and the hands-on activities.. The Learn Path is split into 3 parts, as follows:
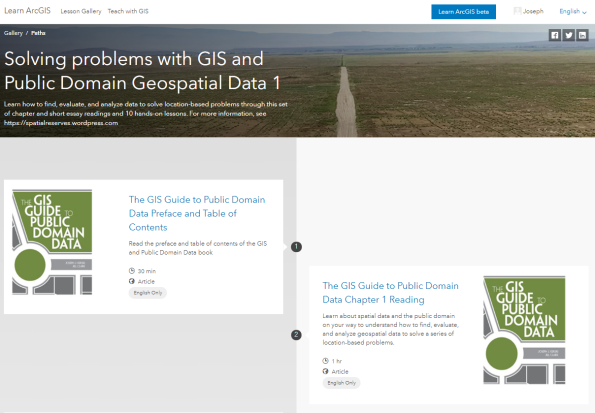
Solving Problems with GIS and public domain geospatial data 1 of 3: Learn how to find, evaluate, and analyze data to solve location-based problems through this set of 10 chapters and short essay readings, and 10 hands-on lessons: https://learn.arcgis.com/en/paths/the-gis-guide-to-public-domain-data-learn-path/
Solving Problems with GIS and public domain geospatial data 2 of 3: https://learn.arcgis.com/en/paths/the-gis-guide-to-public-domain-data-learn-path-2/
Solving Problems with GIS and public domain geospatial data 3 of 3: https://learn.arcgis.com/en/paths/the-gis-guide-to-public-domain-data-learn-path-3/
The Learn Paths allow for content to be worked through in sequence, as shown below:
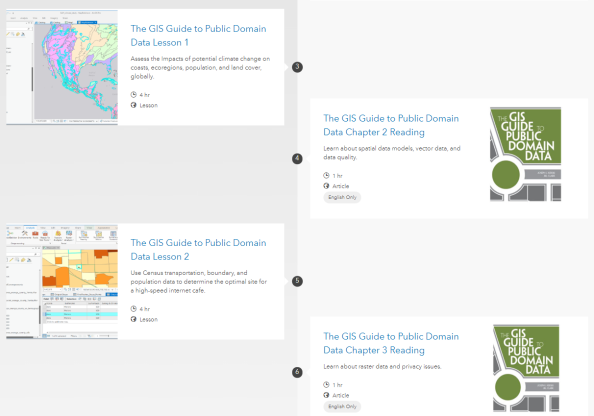

Sample Learn Path for the public domain data activities.
You can also access the lessons by accessing this gallery in ArcGIS Online, shown below. If you would like to modify the lessons for your own use, feel free! This is why the lessons have been provided in a zipped bundle as PDF files here and as MS Word DOCX files here. This video provides an overview.
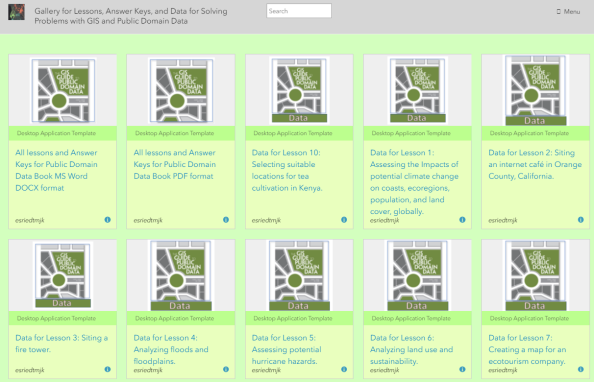
Appearance of content items in the public domain data activities and reading gallery. The gallery includes lessons, data, readings, and the answer keys.
While the intent is for learners to actually download or stream the data from the original sources as an important part of the learning experience, the data for each lesson in zip file format are also included, in this ArcGIS Online gallery. The reason the data is provided is because we recognize that sometimes, bandwidth is limited and/or the data portals are slow, change, or are temporarily offline.
Titles of the 10 Lessons: See below. For more information, see the detailed metadata for the lessons here.
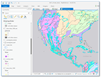 Lesson 1: Assessing impacts of climate change on coasts, ecoregions, and population globally.
 Lesson 2: Siting an internet café in Orange County, California.
 Lesson 3: Siting a fire tower in the Loess Hills, Nebraska.
 Lesson 4: Analyzing floods and floodplains along the Front Range, Colorado.
 Lesson 5: Assessing potential hurricane hazards in Texas.
 Lesson 6: Analyzing land use and sustainability in Brazil.
 Lesson 7: Creating a map for an ecotourism company in New Zealand.
 Lesson 8: Assessing citizen science portals and analyzing data about invasive species.
 Lesson 9: Investigating 3 hazards: Gulf oil spill, Eyjafjallajokull volcano, and Haiti earthquake.
 Lesson 10: Selecting the most suitable locations for tea cultivation in Kenya.
The intent of the lessons was that they were to be used in conjunction with reading the book. Therefore, the contents of the book have also been placed online. The book chapters are in this gallery. The book not only discusses sources and types of spatial data, but also issues such as assessing data quality, open data access, spatial law, the fee vs. free debate, data and national security, the efficacy of spatial data infrastructures, and the impact of cloud computing and the emergence of GIS as a Software-as-a-Service (SaaS) model.
Since the book was published, ongoing social and technological innovations and issues continue to change how data users and data providers work with geospatial information to help address a diverse range of social, economic and environmental needs. Therefore, we established the Spatial Reserves blog to promote a current, ongoing dialogue with data users and providers and post frequent assessments of new tools, data portals, books and articles, curriculum, and issues surrounding spatial data. Recent entries include “Imagery–It is what it is–well, not always.”, “Be a wise consumer of fun posts, too“, “The Application for Extracting and Exploring Analysis Ready Samples (AppEEARS)”, reflections on a new article about the geospatial data fabric, facial recognition technology, and a list of the top 12 sites for Landsat data. A selection of these blog essays are listed in the book’s resources page at Esri Press.
Reflections on Migrating Lessons from ArcMap to ArcGIS Pro. Readers of this blog and the GeoNet education blog are familiar with the rapid change of the field of geospatial technologies, coupled with rapidly changing educational and workplace needs. I contend that given these changes, the content and skills we must teach, and the means by which we teach, must also change. Given the wide variety of tutorials and help files containing graphics and videos, networks and the tools to collaborate, ask questions, and share ideas, students, faculty, and GIS professionals have an amazing variety of learning options at their fingertips.
Thus, I do not believe we need to be focused on tool-based approaches, such as how to geocode, how to georegister, and so on, but rather, how to solve problems using GIS. (For a related discussion, see David DiBiase’s Stop Teaching GIS essay). We need to help students “learn how to learn” whether in GIS (and, I contend, in any other field), emulating the kind of resource gathering, networking, and problem solving that they will assuredly use in the workplace. Some might argue that writing and asking students to go through lessons such as the 10 I describe above is no longer needed. In my experience in teaching for over 25 years at the university level, I still find that this style of lesson still has a place in learning, as students using these go through an entire workflow of geographic inquiry, including asking geographic questions, gathering data, analyzing data, making decisions, making assessments, and communicating the results of their research. Another reason why I created the above lessons is so that you can place each lesson side-by-side to compare the ArcMap version and the ArcGIS Pro version.
My observations after creating ArcGIS Pro versions of each of the ArcMap lessons are as follows:
- I have used these lessons in several different universities, including at the University of Denver, and always pose a survey question about ArcGIS Pro at the end of the course. In 95% of the responses, students have stated that they found ArcGIS Pro to be easier to learn from than ArcMap, more intuitive, and more powerful. Several students each term tell me that the use of Pro was one of their primary reasons for taking the course, because their employer asked them to learn it. And moving forward into the 2020s, Pro will see further adoption and more importantly, further evolution. Every time it evolves, it becomes more powerful and easier to use at the same time.
- As an instructor, you have a choice of either creating your own lessons or using existing lessons. There are no shortage of existing lessons, ranging from the ArcGIS Learn library to shared higher education resources (such as GeoTech Center and iGETT), Esri and university MOOCs, and many other resources. Many of us, however, became instructors because we enjoy creating and customizing curriculum for specific courses and programs. If you are keen on migrating some of your existing ArcMap lessons to ArcGIS Pro, I did it, and so can you. Yes, it will take some time, but I find migrations (migrations is plural here, as I have lived through many such software migrations!) are like when you get rid of things while moving your own residence–it is a good opportunity to purge old content and make things even better. Perhaps you can get a graduate student to assist you in this effort!
- I found that my ArcGIS Pro lessons were shorter than the ArcMap lessons for several reasons. The first reason is that the workflows in ArcGIS Pro are so much more logical and straightforward than in ArcMap. In ArcMap, for example, when you needed to georegister an unprojected historical map or aerial photo, you are cast into a zone that sometimes left students wondering, “what step do I do first?” whereas with ArcGIS Pro, you are placed into wizard-driven “Step 1–do this, make these choices, satisfied? If not, here are some adjustments you can make. OK – on to Step 2…” Ditto for hundreds of other tools and processes: These are much easier to follow and learn from using ArcGIS Pro. The second reason is you don’t need to screen shot everything any longer, and in fact, I implore you to please not screen shot very much, because: (1) There are many good existing resources for use if a student gets stuck on a certain section. In the past, I admit that all of us did have to create our own graphics and screenshots because these were by and large all the students could use as instructional resources, but no longer! (2) Students, being the resourceful people they are, will not read your precious screen shots very much if at all. They know there are other resources and will find them if they have difficulty. Of course you can provide guidance as to where these resources are, but just like anything else these days that people want to learn, such as fixing a faucet or playing the ukulele, there is a video, a graphic, a tutorial, on everything from geocoding to writing Arcade expressions and more. (3) If you do screen shot to excess and make your lessons consequently long, you will remain in a continuous cycle of having to update and curate your lessons. Please, don’t do this! Rather, spend less time updating curriculum, and that new-found time creating new curricular ideas, teaching techniques, and furthering your own research.

Metadata for Public Domain Data lessons.
I look forward to your comments below.
–Joseph Kerski
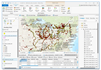
How to create and manage metadata in ArcGIS Pro
Metadata is a recurring theme in this blog, and rightly so–without metadata, you have no way of determining if the data set you wish to use is fit for your use. My Esri colleague Colin Childs wrote an essay that guides a person through the creation and management of metadata in ArcGIS Pro, here. Central to Colin’s guidelines is working through a project package that is part of the Learn ArcGIS lesson library. Tasks you work through here include changing the metadata style to the Federal Geographic Data Committee‘s (FGDC) Content Standard for Digital Spatial Metadata (CSDGM). After adding the metadata elements to the data for a county in Mississippi, you explore the metadata for the data sources referenced by the map, including the all-important spatial reference.
After these activities, Colin encourages the reader to streamline these tasks by creating a metadata template. He says, “An organization-wide metadata template can include basic contact and distribution information and legal restrictions that apply to all items. An organizational template can be the basis for project-specific templates that include the purpose for which the project and its items were created, standard place names describing the geographic region in which the work takes place, and how the project’s deliverables will be distributed and maintained.”
Some of the metadata that you work with in this lesson.
I highly encourage you to read the article and go through this activity.
–Joseph Kerski
A review of the ArcGIS Pro Cookbook
GIS Professional Tripp Corbin’s book, the “ArcGIS Pro 2.x Cookbook” (2018, Packt Publishing) is new but I believe will quickly become a valued and oft-used resource. Mr Corbin’s goal in writing this extensive (694 pages) resource is to help GIS professionals “create, manage, and share geographic maps, data, and analytical models using ArcGIS Pro.” The audience for this book includes all who are learning GIS, or learning Pro, as well as those migrating from ArcMap to Pro.
Tripp’s “cookbook” theme is evident throughout the book’s format, where in each section and problem to be solved, he shows how to get ready, how to do it, how it works, and … “there’s more” (additional resources). That the book is from Packt is excellent, because Packt (www.packtpub.com) offers eBook versions of every one of its books, and also offers newsletters and tech articles. That Tripp is a full time trainer and instructor is evident–he understands the challenges in learning a rapidly-changing and complex technology inherent in GIS with just enough tips to keep the reader engaged. He also encourages the reader to think about how to apply each tool and method to his or her own work. He offers the reader the ability to download the sample data for the book, and the data bundle is also on GitHub. He also includes PDFs of all images of screen shots and diagrams.
I like Tripp’s approach because, similar to my own instruction, and central to the theme of this blog, he starts with data. He’s not hesitant to discuss the benefits but also the limitations of each data format such as shp, gdb, and CAD files. He spends quality time in the book helping the reader understand how to convert data to the format that best fits his or her needs. His sections on linking tables from outside sources to existing data, on editing (in particular, a focus on topologies to improve data accuracy and increasing editing efficiency), and on 2D and 3D analysis are very helpful. I was pleased to see much attention to what I consider to be a chief advantage of Pro–the ability to more easily share content from Pro to ArcGIS Online and hence the wider community. Another wonderful new function in ArcGIS Pro is also included in the book–writing and using Arcade scripts, applied to symbology, classification, and analysis.
As a GIS book author, I know the challenges faced in writing such a book–what should be included, and what should be left out? Tripp does a nice job here as well, including the fundamentals that most users will touch. The book’s chapters include: 1: Capabilities and terminology. 2: Creating and storing data. 3: Linking data together. 4: Editing spatial and tabular data. 5: Validating and editing data with topologies. 6: Projections and coordinate systems. 7: Converting data from one format to another. 8: Proximity analysis. 9: Spatial statistics and hot spots. 10: 3D maps and 3D analyst. 11: Arcade, labeling and symbology expressions. 12: ArcGIS Online, 13: Publishing your own content to ArcGIS Online. 14: Creating web apps using ArcGIS Online.
These chapters cover a great deal of ground. In the editing chapter, for example (Chapter 4), configuring editing options, reshaping existing, splitting, merging, aligning, creating new point line polygon features, creating new polygon feature using autocomplete, and editing attributes using attribute pane and in the table view, are all examined. The examples in the book are interesting and relevant, and not without some humor (Trippville is a community that is often studied). In my view, the book contains just the right amount of graphics. Tripp provides answers to the questions he poses, and then gives the explanation for each answer. Despite the “recipes” provided in the cookbook, not all of them require the previous recipe to be used, which is excellent for all of us in GIS who have limited time and want to select sections in a non-sequential order.
I highly recommend using this book in conjunction with Tripp’s other book on this topic, “Learning ArcGIS Pro.” The Learning book focuses on installing, assigning licenses, navigating the interface, creating and managing projecrts, creating 2D and 3D maps, authoring map layouts, importing existing projects, creating standardized workflows using tasks, and automating analysis and processes using modelbuilder and python. The Learning ArcGIS Pro book ideally should be used first, before the ArcGIS Pro 2.x Cookbook, but if you are pressed for time, these two books could be used in tandem. Keep both of them handy–they will be very useful to you.
Covers of Tripp Corbin’s ArcGIS Pro books.
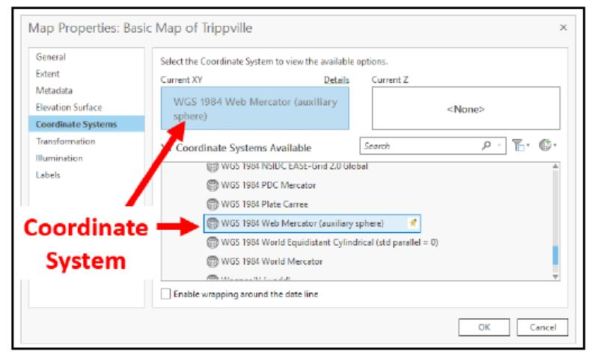
An example of the detail provided in Tripp Corbin’s ArcGIS Pro 2.x Cookbook.
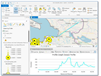
Using the Data Interoperability Extension to import SDTS DLG files into ArcGIS Pro
One of the themes of this blog and our book has been the wide variety of spatial data formats in existence. Some of these spatial data formats have remained challenging to import into a GIS right up to the present day. To meet this challenge, Esri’s Data Interoperability Extension has been a longstanding and useful set of tools that enables a wide variety of spatial data formats to be imported for use in a GIS. It is an integrated spatial ETL (Extract, Transform, and Load) toolset that runs within the geoprocessing framework using Safe Software’s FME technology. It enables you to integrate data from multiple sources and formats, use that data with geoprocessing tools, and even publish it with ArcGIS Server.
I recently tested the Data Interoperability Extension in ArcGIS Pro and was thrilled with the results. Read about how to install and authorize the extension here. The extension does many things, but one that is particularly useful is that the extension creates a toolbox directly in ArcGIS Pro (graphic below). I used this toolbox’s Quick Import tool to import a SDTS Format DLG (USGS Digital Line Graph) file directly to a file geodatabase. The tool, like other ArcGIS Pro geoprocessing tools, walked me right through the process: Data Interoperability > Quick Import > I then pointed to my DLG files in SDTS format > I named the resulting gdb (file geodatabase). Once imported, I was then able to work with my hydrography, hypsography, roads, boundaries, and other data.
DLG files have existed since the early 1990s. Why are we still working with them? The reasons are that (1) They are dated but still useful vector data sets; (2) Many geospatial data portals still host data only in this format, such as the USGS Earth Explorer. Another way to import these DLG files into ArcGIS Pro or ArcMap is to use the DLG2SHP tools that I wrote about in this set of guidelines using a standalone program. See below for step-by-step instructions with the Data Interoperability Extension with screen shots.

1. Use Toolboxes > Data Interoperability Tools > Quick Import, as shown above.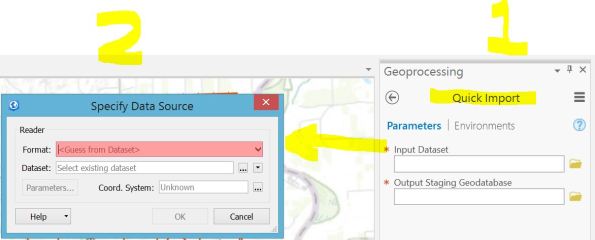
2. Using QuickImport pulls up a “specify data source” dialog box, as shown above.

3. In the specify data source dialog box, use “find other source” and then specify SDTS format.

4. Selecting SDTS format.

5. Pointing to the SDTS file (after it has been unzipped and un-TAR’d) and saving it into a geodatabase.
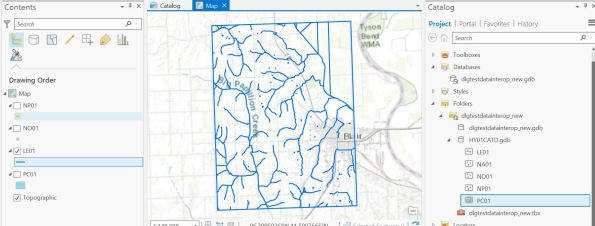
6. Once the file has been imported into a geodatabase, it can be added to a new map in ArcGIS Pro. The data is now ready for use, as shown for this hydrography example, above.
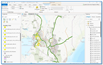
Accessing and Using Lidar Data from The National Map
We have written about the USGS data portal NationalMap numerous times in this blog and in our book, but since the site keeps getting enhanced, a re-examination of the site is warranted. One of the enhancements over the past few years is the addition of Lidar data to the site. I did some recent testing of searching for and downloading Lidar data on the site and wanted to report on my findings. For videos of some of these procedures, go to the YouTube Channel geographyuberalles and search on Lidar.
From a user perspective, in my view the site is still a bit challenging, where the user encounters moments in the access and download process where it is not clear how to proceed. However, (1) the site is slowly improving; (2) the site is worth investigating chiefly because of its wealth of data holdings: It is simply too rich of a resource to ignore. One challenging thing about using NationalMap is, like many other data portals, how to effectively narrow the search from the thousands of search results. This in part reflects the open data movement that we have been writing about, so it is a good problem to have, albeit still cumbersome in this portal. Here are the procedures to access and download the Lidar data from the site:
- To begin: Visit the National Map: https://nationalmap.gov/ > Select “Elevation” from this page.
- Select “Get Elevation Data” from the bottom of the Elevation page. This is one of several quirks about the site – why isn’t this link in a more prominent position or in a bolder font?
- From the Data Elevation Products page left hand column: Select “1 meter DEM.”
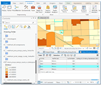
- Select the desired format. Select “Show Availability”. Zoom to the desired area using a variety of tools to do so. In my example, I was interested in Lidar data for Grand Junction, in western Colorado.
- Note that the list of available products will appear in the left hand column. Lidar is provided in 10000 x 10000 meter tiles. In my example, 108 products exist for the Grand Junction Lidar dataset. Use “Footprint” to help you identify areas in which you need data–the footprints appear as helpful polygon outlines. At this point, you could save your results as text or CSV, which I found to be quite handy.
- You can select the tiles needed one by one to add to your cart or select “Page” to select all items. Select the Cart where you can download the tiles manually or select the “uGet Instructions” for details about downloading multiple files. Your data will be delivered in a zip format right away, though Lidar files are large and may require some time to download.
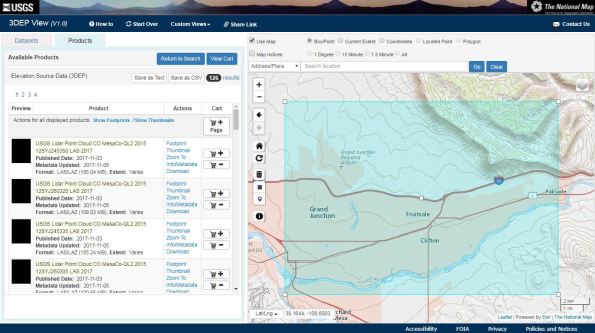
The National Map interface as it appeared when I was selecting my desired area for Lidar data.
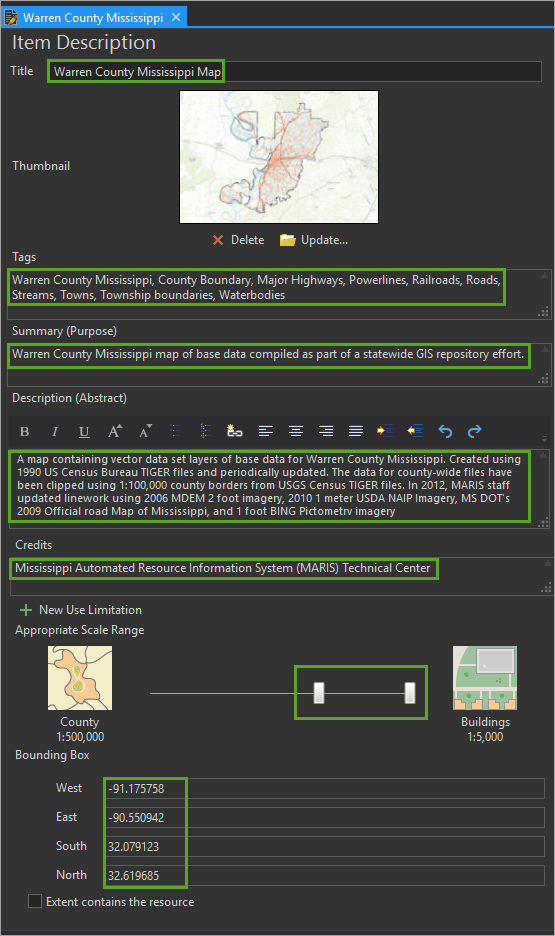
Unzip the LAS data for use in your chosen GIS package. To bring the data into ArcGIS Pro, create a new blank project and name it. Then, Go to Analysis > Tools > Create LAS dataset from your unzipped .las file, noting the projection (in this case, UTM) and other metadata. Sometimes you can bring .las files directly into Pro without creating a LAS dataset, but with this NationalMap Lidar data, I found that I needed to create a LAS dataset first.
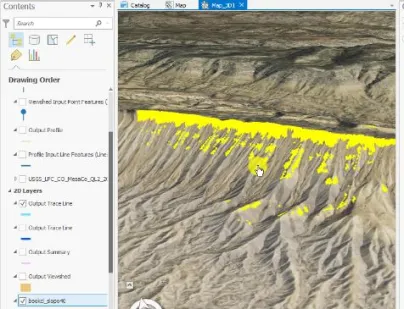
Then > Insert: New Map > add your LAS dataset to the new map. Zoom in to see the lidar points. View your Lidar data in different ways using the Appearance tab to see it as elevation, slope, aspect (shown below), and contours. Use LAS dataset to raster to convert the Lidar data to a raster. In a similar way, I added the World Hydro layer so I could see the watersheds in this area, and USA detailed streams for the rivers.
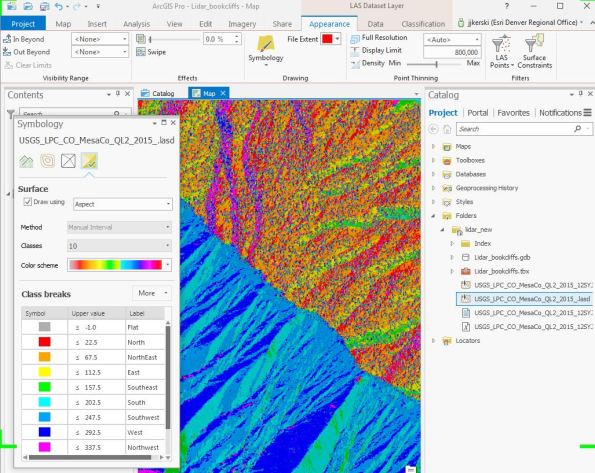
Aspect view generated from Lidar data in ArcGIS Pro.
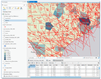
There are many things you can do with your newly downloaded Lidar data: Let’s explore just a few of those. First, create a Digital Elevation Model (DEM) and a Digital Surface Model (DSM). To do this, in your .lasd LAS dataset > LAS Filters > Filter to ground, and visualize the results, and then use LAS Dataset to Raster, using the Elevation as the value field. Your resulting raster is your digital elevation model (DEM). Next, Filter to first return, and then convert this to a raster: This is your digital surface model (DSM). After clicking on sections of each raster to compare them visually, go one step further and use the Raster Calculator to create a comparison raster: Use the formula: 1streturn_raster – (subtract) the ground_raster. The first return result is essentially showing the objects or features on the surface of the Earth–the difference between “bare earth” elevation and the “first return”–in other words, the buildings, trees, shrubs, and other things human built and natural. Symbolize and classify this comparison surface to more fully understand your vegetation and structures. In my study area, the difference between the DEM and the DSM was much more pronounced on the north (northeast, actually) facing slope, which is where the pinon and juniper trees are growing, as opposed to the barren south (southwest) facing slope which is underlain by Mancos Shale (shown below).

Comparison of DEM and DSM as a “ground cover” raster in ArcGIS Pro.

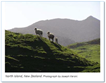
My photograph of the ridgeline, from just east of the study area, looking northwest. Note the pinon and juniper ground cover on the northeast-facing slopes as opposed to the barren southwest facing slope.
Next, create a Hillshade from your ground raster (DEM) using the hillshade tool. Next, create a slope map and an aspect map using tools of these respective names. The easiest way to find the tools is just to perform a search. The hillshade, slope, and aspect are all raster files. Once the tools are run, these are now saved as datasets inside your geodatabase as opposed to earlier—when you were simply visualizing your Lidar data as slope and aspect, you were not making separate data files.
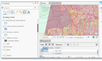
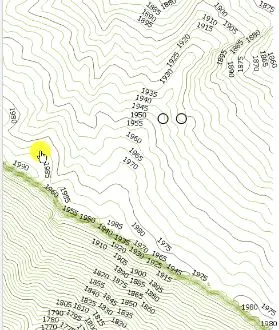
Next, create contours, a vector file, from your ground raster (DEM), using the create contours tool. Change the basemap to imagery to visualize the contours against a satellite image. To create index contours, use the Contour with Barriers tool. To do this, do not actually indicate a “barriers” layer but rather use the contour with barrier tool to achieve an “index” contour, as I did, shown below. I used 5 for the contour interval and 25 (every fifth contour) for the index contour interval. This results in a polyline feature class with a field called “type”. This field receives the value of 2 for the index contours and 1 for all other contours. Now, simply symbolize the lines as unique value on the type field, specifying a thicker line for the index contours (type 2) and a thinner line for all the other contours.
Next, convert your 2D map to a 3D scene using the Catalog pane. If you wish, undock the 3D scene and drag it to the right side of your 2D map so that your 2D map and 3D scene are side by side. Use View > Link Views to synchronize the two. Experiment with changing the base map to topographic or terrain with labels. Or, if your area is in the USA like mine is, use the Add Data > USA topographic > add the USGS topographic maps as another layer. The topographic maps are at 1:24,000 scale in the most detailed view, and then 1:100,000 and 1:250,000 for smaller scales.
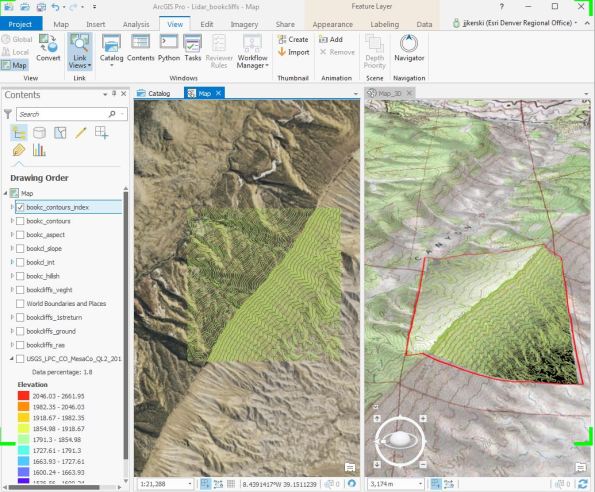
2D and 3D synced views of the contours symbolized with the Contours with Barriers tool in ArcGIS Pro.
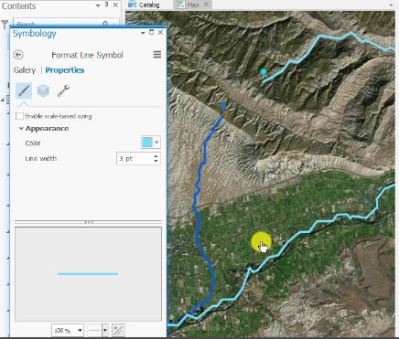
At this point, the sky’s the limit for you to conduct any other type of raster-based analysis, or combine it with vector analysis. For example, you could run the profile tool to generate a profile graph of a drawn line (as I did, shown below) or an imported shapefile or line feature class, create a viewshed from your specified point(s), trace downstream from specific points, determine which areas in your study site have slopes over a certain degree, or use the Lidar and derived products in conjunction with vector layers to determine the optimal site for a wildfire observation tower or cache for firefighters.


Profile graph of the cyan polyline that I created from the Lidar data from the National Map in ArcGIS Pro.
Tracing downstream using the rasters derived from the lidar data in ArcGIS Pro.
Slopes over 40 degrees using the slope raster derived from the lidar data in ArcGIS Pro.
I hope these procedures will be helpful to you.
Contributors
Gallery


Recent Comments