Archive
The Good Ole Bad Days: Pixels, Scale and Appropriate Analysis
By Jim Smith, LANDFIRE Project Lead, The Nature Conservancy
Recently I saw a bumper sticker that said, “Just because you can doesn’t mean you should.” I couldn’t have said it better, especially regarding zooming in on spatial data.
Nowadays, (alert—grumble approaching), people zoom in tightly on their chosen landscape, region, and even pixel, whether the data support that kind of close-up view or not. Understandably, that means a LOT of misapplication of perfectly good science followed by head scratching and complaining.
To set a context, I want to look at the “good ole days” when people used less precise spatial data, but their sense of proportion was better. By “ole,” I mean before the mid-1980s or so, when almost all spatial data and spatial analyses were “analog,” i.e. Mylar map layers, hard copy remote sensing images and light tables (Ian McHarg’s revelation?). In 1978, pixels on satellite images were at least an acre in size. Digital aerial cameras and terrain-correct imagery barely existed. The output from an image processing system was a line printer “map” that used symbols for mapped categories, like “&” for Pine and “$” for Hardwood (yes, smarty pants, that was about all we could map from satellite imagery at that time). The power and true elegance we have at our finger tips today was unfathomable when I started working in this field barely 30 years ago.
Let me wax nostalgic a bit more – indulge me because I am an old GIS coot (relatively anyway). I remember command line ArcInfo, and when “INFO” was the actual relational data base used by ESRI software (did you ever wonder where the name ArcInfo came from?). I remember when ArcInfo came in modules like ArcEdit and ArcPlot, each with its own manual, which meant a total of about three feet of shelf space for the set. I remember when ArcInfo required a so-called “minicomputer” such as a DEC VAX or Data General, and when an IBM mainframe computer only had 512K [not MB or GB] RAM available. I know I sound like the clichéd dad telling the kids about how bad it was when he was growing up — carrying his brother on his back to school in knee-deep snow with no shoes and all that — but pay attention anyway, ‘cause dad knows a thing or two.
While I have no desire to go back to those days, there is one concept that I really wish we could resurrect. In the days of paper maps, Mylar overlays, and photographic film, spatial data had an inherent scale that was almost always known, and really could not be effectively ignored. Paper maps had printed scales — USGS quarter quads were 1:24,000 — one tiny millimeter on one of these maps (a slip of a pretty sharp pencil) represented 24 meters on the ground — almost as large as a pixel on a mid-scale satellite image today. Aerial photographs had scales, and the products derived from them inherited that scale. You knew it — there was not much you could do about it.
Today, if you care about scale, you have to investigate for hours or read almost unintelligible metadata (if available) to understand where the digital spatial data came from — that stuff you are zooming in on 10 or 100 times — and what their inherent scale is. I think that most, or at least many, data users have no idea that they should even be asking the question about appropriate use of scale — after all the results look beautiful, don’t they? This pesky question means that users often worry about how accurately categories were mapped without thinking for a New York minute about the data’s inherent scale, or about the implied scale of the analysis. I am especially frustrated with the “My Favorite Pixel Syndrome” when a user dismisses the entire dataset because it mis-maps the user’s favorite 30-meter location, even though the data were designed to be used at the watershed level or even larger geographies.
So, listen up: all that fancy-schmancy-looking data in your GIS actually has a scale. Remember this, kids, every time you nonchalantly zoom-in, or create a map product, or run any kind of spatial analysis. Believe an old codger.

The Good Ole Bad Days: Pixels, Scale and Appropriate Analysis.
—–
Authors: This week’s post is guest written from The Nature Conservancy’s Landfire team, which includes Kori Blankenship, Sarah Hagen, Randy Swaty, Kim Hall, Jeannie Patton, and Jim Smith. The Landfire team is focused on data, models, and tools developed to support applications, land management and planning for biodiversity conservation. If you would like to guest write for this Spatial Reserves blog about geospatial data, use the About the Authors section and contact one of us about your topic.
Trading Services For Location Information
The popular music streaming service Spotify recently announced an updated set of terms and conditions. In addition to stated intentions to access contact information and photographs stored on a mobile device, for those using the Spotify Running feature the service would also collect location data.
Depending on the type of device that you use to interact with the Service and your settings, we may also collect information about your location based on, for example, your phone’s GPS location or other forms of locating mobile devices (e.g., Bluetooth). We may also collect sensor data (e.g., data about the speed of your movements, such as whether you are running, walking, or in transit). – Spotify
For many service providers such as Spotify, personal location information is just one of the data sources they can tap in to provide a more personal service and Spotify are not the first service to want access. The trade off we have as consumers of those services is does the service we want to use justify trading some of our personal information. Before consenting to that trade off we need to understand how, what, and when data is collected, who will use it (third party access?) and if we can opt out of sharing this information.
In responding to some of the negative feedback to the announcement from users concerned about how their personal information was being used, Spotify acknowledged that they didn’t do a good job communicating the updated terms and conditions and what they meant to say was…..
Location: We will never gather or use the location of your mobile device without your explicit permission. We would use it to help personalize recommendations or to keep you up to date about music trending in your area. And if you choose to share location information but later change your mind, you will always have the ability to stop sharing. – Spotify
For some the new personal service will appeal, for others it will be a tracked step too far. The important thing for all users is sufficient information to make an informed decision before accepting the new terms and conditions.
Know Your Data! Lessons Learned from Mapping Lyme Disease
I have taught numerous workshops using Lyme Disease case counts from 1992 to 1998 by town in the state of Rhode Island. I began with an Excel spreadsheet and used Esri Maps for Office to map and publish the data to ArcGIS Online. The results are shown on this interactive map.
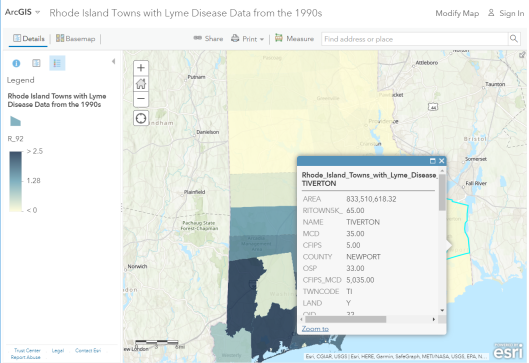
Rhode Island Lyme Disease rates from the 1990s.
As the first decade of the 2000s came to a close, my colleague and I wanted to update the data with information from 1999 to the present, and so we contacted the people at the Rhode Island Department of Health. They not only provided the updated data, for which we were grateful, but they also provided valuable information about the data. This information has wider implications for data quality in general that we frequently discuss on this Spatial Reserves blog.
The Public Health staff told us that the Lyme disease surveillance is time and resource intensive. During the 1980s and 1990s, as funding and human resource capacity allowed, the state ramped up surveillance activities including robust outreach to healthcare providers. Prioritizing Lyme surveillance allowed the state to obtain detailed clinical information for a large number of cases and classify them appropriately. The decrease observed in the 2004-2005 case counts was due to personnel changes and a shift in strategy for Lyme surveillance. Resource and priority changes reduced their active provider follow up. As a result, in the years since 2004, the state has been reporting fewer cases than in the past. They believe this decrease in cases is a result of changes to surveillance activities and not to a change in the incidence of disease in Rhode Island.
If this isn’t the perfect example of “know your data”, I don’t know what is. If one did not know the above information, an erroneous conclusion about the spatial and temporal patterns of Lyme disease would surely have occurred. This kind of information often does not make it into standard metadata forms. This therefore is also a reminder that contacting the data provider is often the most helpful way of obtaining the “inside scoop” on how the data was gathered. See my video highlighting these points. And rest assured that we made certain that this information was included in the metadata when we served this updated information.
–Joseph Kerski
New and Updated OpenStreetMap Editors
Recent updates to Esri’s ArcGIS Editor for OpenStreetMap (OSM) add-on and a new OSM edit option in GitHub highlight the continuing popularity of OSM as one of the go-to base layers for many online mapping applications. In April this year, Esri announced the release of ArcGIS Editor for OSM 10.3x, providing an updated free and open source desktop toolset to download, edit and publish updates to OSM.
Two years ago we wrote about the then new option to upload and visualise geoJSON format spatial data in GitHub against a base map provided by OSM. GitHub have now extended the options for viewing and collaborating on spatial data sets to include the base map itself, with a new option to improve the underlying map for registered GitHub and OSM users.

Registered users can either edit the base map themselves or for those who haven’t registered with OSM, leave a note for another editor to review and resolve. Use of the OSM data remains subject to the terms and conditions of the Open Data Common Open Data Licence.
Metadata Enhancements in ArcGIS Online
Geospatial metadata has been described as the language that enables information sharing and discovery. The International Standards Organization (ISO) uses this wording in its “scope” section: “This International Standard provides information about the identification, the extent, the quality, the spatial and temporal schema, spatial reference, and distribution of digital geographic data.” The US Federal Geographic Data Committee (FGDC) defines it as, “A metadata record is a file of information, usually presented as an XML document, which captures the basic characteristics of a data or information resource. It represents the who, what, when, where, why and how of the resource. Geospatial metadata are used to document geographic digital resources such as Geographic Information System (GIS) files, geospatial databases, and earth imagery. A geospatial metadata record includes core library catalog elements such as Title, Abstract, and Publication Data; geographic elements such as Geographic Extent and Projection Information; and database elements such as Attribute Label Definitions and Attribute Domain Values.” In Chapter 5 of our book, we discuss these standards and the importance of metadata in more detail.
ArcGIS desktop software from Esri has for many years supported formats for organizations to attach metadata in a variety of accepted formats. Recently, ArcGIS Online’s support for metadata was enhanced. Metadata in ArcGIS Online has always been created, edited, and viewed in the item details page, but up to now, this has required a manual process, reliant on the person or organization creating the data to input the contents. ArcGIS Online now allows organizations to “enable metadata”, which means that they can include additional standards-based metadata for all item types using a built-in metadata editor. It can be used for web maps, scenes, and web apps. Once enabled, a “metadata” button appears on the detail pages for the owner of that data set and for anyone with access to view the data, they too see a metadata button to view that as well.
Any of the following styles can be chosen: FGDC CSDGM Metadata (Content Standard for Digital Geospatial Metadata), the INSPIRE Metadata Directive, according to ISO 19139 standards, ISO 19139 Metadata Implementation Specification GML3.2, identical to the one above, except the exported files use the GML 3.2 namespace, ISO 19139 Metadata Implementation Specification, allowing to view and edit a complete metadata document that complies with ISO standard 19139, and the North American Profile of ISO 19115 2003.
How can you port metadata from ArcGIS desktop to ArcGIS Online? Standards-based metadata for shapefile are stored in an accompanying metadata XML file where the shapefile is stored. To extract the metadata from a file geodatabase, use the geoprocessing XSLT Transformation tool with the exact copy of. the xslt stylesheet to export the metadata content to a stand-alone metadata XML file in the ArcGIS metadata format.
Support for standard metadata content welcome news, and we expect that metadata from ArcGIS Pro will one day soon be supported as well.

Metadata in ArcGIS Online was recently enhanced with standards-based metadata.
Contributors
Gallery


Recent Comments