Archive
Exploring National Data Hubs
National data hubs provide data about a nation’s people, place, and economy. National portals and libraries are intended to help users gain access to basic information to keep users well informed and assist in good policy and decision making. Of interest to the readers of this blog is that increasing numbers of national portals include geospatial data in their offerings.
A selected short list of these is as follows:
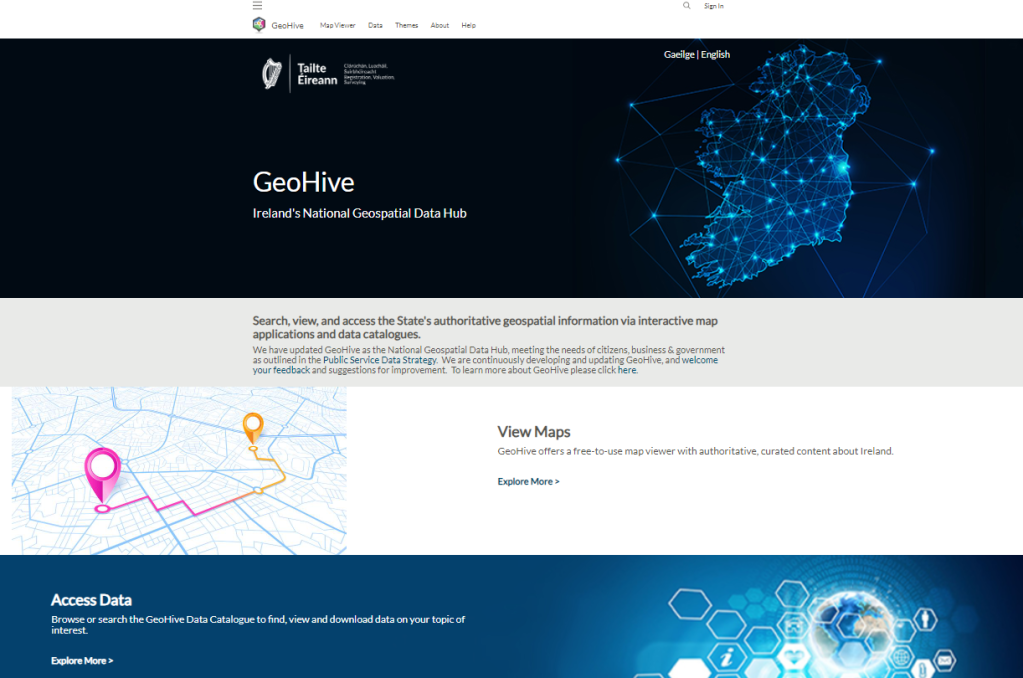
Ireland: https://www.geohive.ie/
Australia: https://digital.atlas.gov.au/
Burkina Faso SDG hub: https://sustainable-development-goals-bfdatahub.hub.arcgis.com/
The UAE: https://1map-fcsa.hub.arcgis.com/
Saudi Arabia SDG hub: https://www.geoportal.sa/portal/apps/sites/#/ksa-sdgs-en/ which is very newly launched.
Many of the above in my opinion can be viewed as “best practice” that others could emulate for example using ArcGIS Hub’s ease-of-use and functionality. The hub sites feature data but also selected data stories–the most critical issues to {Country/ citizens e.g., Jamaicans or Kenyans} is a healthy and stable population, a prosperous economy and a healthy natural environment. Key to reaching these goals are programs focused on education, health care, social protections and initiatives to support a stable and sustainable economy as well as those focused on protecting the nation’s natural resources and unique environment. These stories connect with these issues and highlight the need to collect, compile, and communicate, so that information will be available to decision makers in a wide variety of formats, including maps and geospatial data layers.
One of the most useful features of any of these sites, which should be of interest to the readers of this data blog, is embedded web maps, often available at multiple scales.
I encourage you to investigate this resource and look forward to hearing your reactions. Some other data hubs are listed here. Do you know of other ArcGIS Hub sites or other data libraries focused on official statistics? If so, feel free to share them in the comments section.
–Joseph Kerski
Urbanization and human settlement data on the UN-HABITAT Open Data Portal
The UN-HABITAT OPEN DATA portal, https://data.unhabitat.org/, is an interesting and useful way to obtain data on urbanization and human settlement. UN-Habitat, the United Nations Human Settlements Programme, is mandated by the UN General Assembly to promote socially and environmentally sustainable towns and cities. It is the focal point for all urbanization and human settlement matters within the UN System. The creation of sustainable human settlements requires the provision and application of accurate, up to date, timely and reliable data.
The portal’s Compilation of Urban Indicators Data allows the user to explore by SDG Goals, by specific themes such as land and environment, quality of life, governance, and others. You can also explore all data in the library.
Because the site uses ArcGIS Hub technology, the site is responsive, and you can easily search for data of interest. You can also search for type of document, such as web mapping application or dashboard. I used the site to search for land cover data and was pleased at the variety (scales, locations) and volume of results. At the time of this writing, 132 countries, 77 indicators, and 1500 urban areas are covered in the portal. The chief challenge with this and similar sites is to effectively narrow what you are seeking.

–Joseph Kerski
A review of the ArcGIS Hub Gallery
As we have described in this blog, ArcGIS Hub is a set of templates and tools that allow organizations to more easily share their geospatial data holdings and also to engage the community. ArcGIS Hub has emerged over the past few years as a primary way that organizations are sharing geospatial data, and thus is germane to the theme of this blog and our book.
One of the resources that is worth frequently checking is the ArcGIS Hub gallery. The sites in this gallery range from those created by local, regional, and national governments, international agencies, nonprofits, universities, to those created by private companies. At the current time, you can search by these “sectors” but also on Focus Areas: Transportation | Elections | Census 2020 | Financial Transparency | Volunteerism | Open Data.
I advise “frequently checking” because the gallery is actively curated and changes often. But the resources are vast and varied!

–Joseph Kerski
Top 7 Satellite Imagery Sources
My colleagues at EOS.com recently wrote a summary of what they consider to be the top 7 satellite imagery sources: https://eos.com/blog/7-top-free-satellite-imagery-sources-in-2019/.
These include sources that we have reviewed on this Spatial Reserves blog, here: https://spatialreserves.wordpress.com/2019/02/18/the-top-10-most-useful-geospatial-data-portals-revisited/ as well as the top Landsat sites that we reviewed, here: https://spatialreserves.wordpress.com/2019/08/04/the-top-10-landsat-image-sites/, but it also includes a few we have not reviewed, such as EOS’ own Landviewer.
It is good to see reviewed collections such as these that have an aim to make life a bit easier for us as data consumers and analysts.
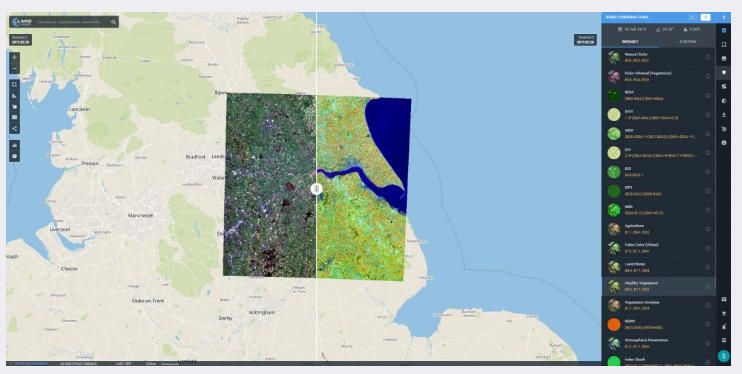
Landviewer data portal, from EOS.
–Joseph Kerski
Finding data via ArcGIS Hubs around the world
As of 2017, over 10,000 open data sites have been published by governments all over the world using ArcGIS Hub technology, as described here. I recently wrote about how to use the ArcGIS Hub open data portal to search for and find geospatial data. This story map is another way to find data, because it lists and provides access to some of these hubs. The story map shows 1,500 sites created back in 2017, so while only a fraction of the total, the map provides an excellent way to browse and find spatial data. I used it recently to easily find transportation spatial data in Victoria, Australia, for example, for the purpose of constructing a GIS lesson around. Update: I do not have the exact figures for 2020, but there must be multiple tens of thousands of Hub sites in existence by now.
Equally important as accessing the data is that the story map raises the important point that the open spatial data movement is more than just about sharing data. As we have written about extensively in this blog, the open spatial data movement is a reflection of the transformation that GIS is bringing in the way government, private, and nonprofit organizations work. This increased collaboration between departments and engagement with citizens is a long-term and oft-difficult effort, but is resulting in increased efficiency, and yes, in data access for all.
Try this story map as a way to discover spatial data, particularly by region, and I think you will find it to be a useful tool. For more information and background on ArcGIS Hub, see this essay by my colleague Andrew Turner.
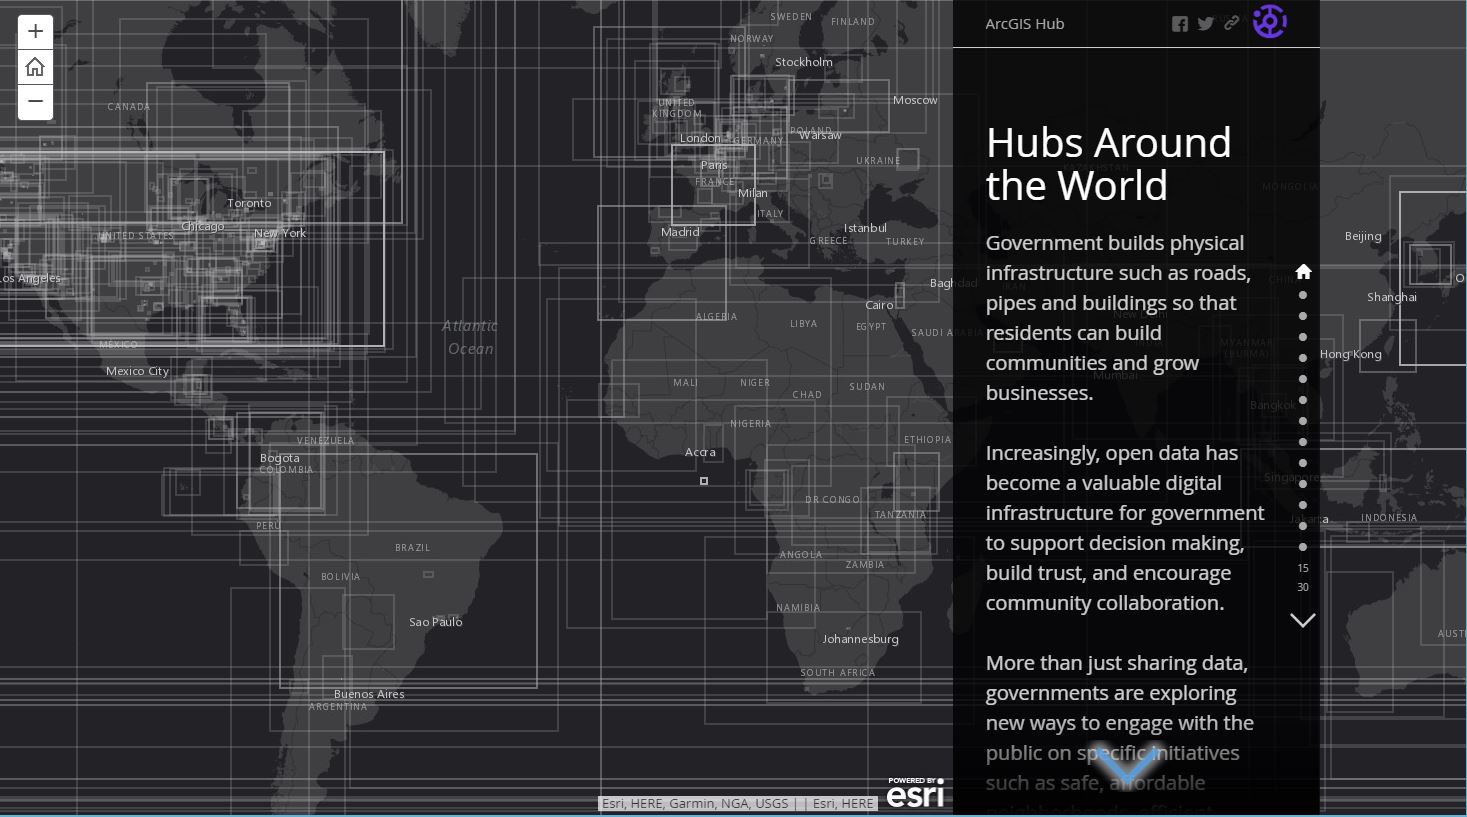
Hubs around the world story map. This map provides a description and access to dozens of data sets served via ArcGIS Hub portal technology.
A Review of the Geoportal
The GEOSS is a portal run by the European Space Agency (ESA) Group and the Group on Earth Observations (GEO) that provides one way to access earth observation data from around the world. The site focuses on satellite imagery–Sentinel and Landsat data. One helpful feature about the site is the ability to send search results to social media or via email. A list of Popular Searches is a good place to start with the site. The site is definitely worth investigating as it features a wealth of data. I found myself wishing that there were more predefined searches listed there (currently 4). The site also offers a login option and the ability to save your “workspace” which is an intriguing idea; using this feature, you could come back to the site and continue searching and downloading with the knowledge of what you have done previously. There are different formats available, although at many points in my work with the site, I was confused as to how to proceed, or what format my file would be in, and if I was truly downloading the extent shown in the interface.
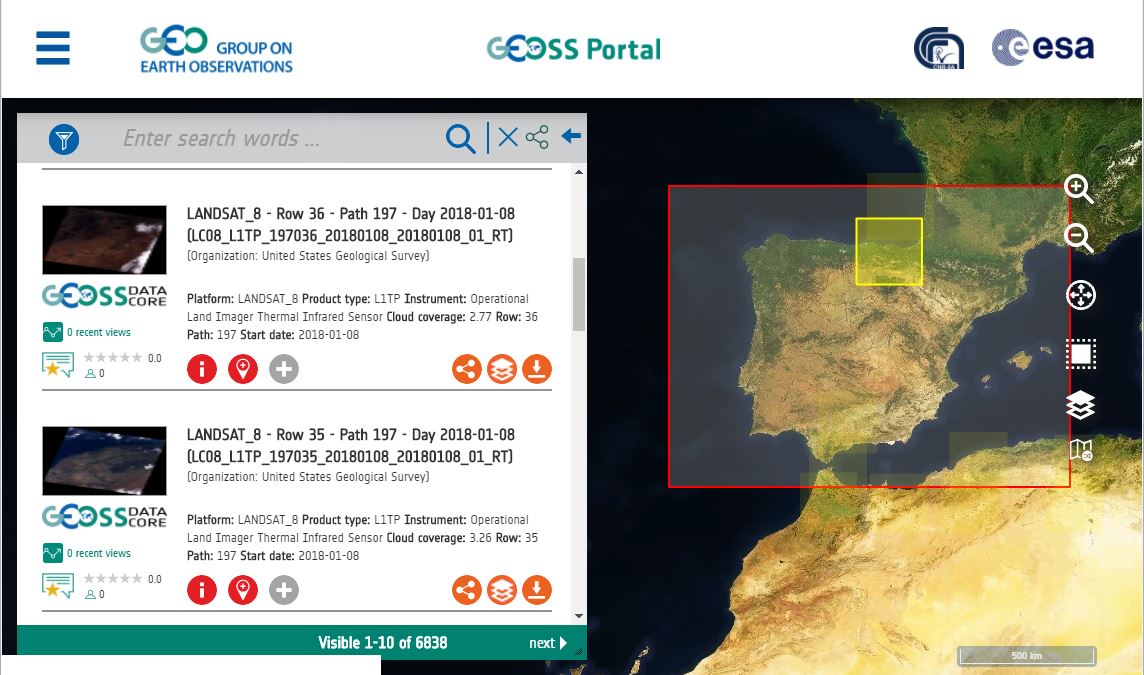
Interface for the Geoportal.
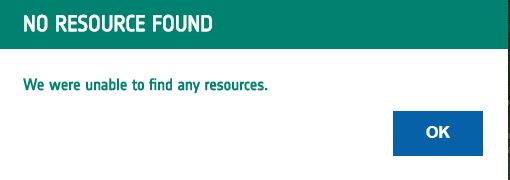
Like other portals, this one allows search terms, but without knowing what is there, the user is left with some confusion knowing what search terms to use. I found myself really wanting a tutorial and a list of data sets I could browse through. Searching is good but the users also need to know what the possibilities are. I am intrigued by the data offerings on the site but had trouble navigating and discovering resources; I frequently encountered this message below and even had trouble drawing the bounding box for my desired search area.
Given the data holdings that are available via this portal, I think it is worth investigating further. The about page on Geoportal lists enhancements to the site that are continually being made, and the mission of the page states that one goal is to make the site intuitive and easy to use. I therefore have high hopes that it will be moving in this direction. Give it a try!
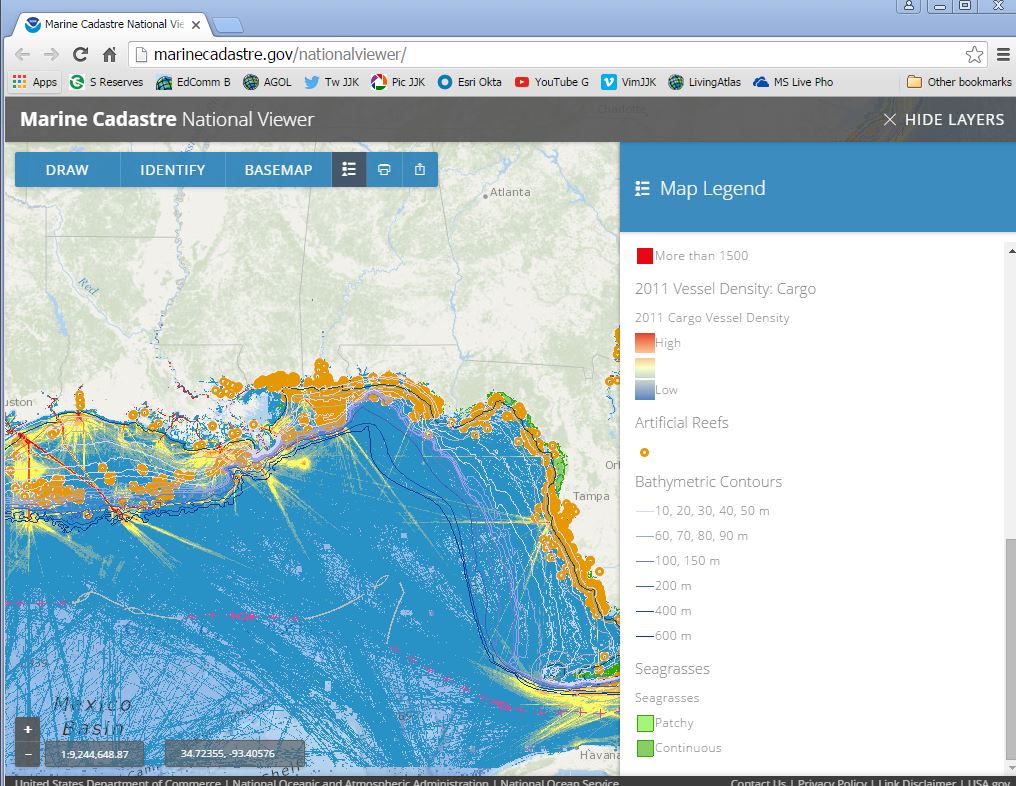
Marine Cadastre Data Viewer and Portal
The Marine Cadastre Data Viewer and Portal provides direct access to authoritative marine cadastral data from U.S. federal and state sources, including information on the tracks of vessels, bathymetry, administrative boundaries, and fish, bird, and other species. It provides baseline information needed for ocean planning efforts, particularly those that involve finding the best location for renewable energy projects. The MarineCadastre.gov National Viewer uses Esri web GIS technology and is also a helpful tool in the permit review process. Users can select the ocean geography of their choosing and quickly see the applicable jurisdictional boundaries, restricted areas, laws, critical habitat locations, and other important features. With the national viewer, potential conflicts can be identified and avoided early in the planning process.
The site offers two distinct advantages: 1) The ability to view over 75 data layers from a variety of sources in a single live ArcGIS Online-based web map viewer; 2) The ability to download those same layers from the map interface for additional analysis. We have been critical in this blog about sites that get the user tantalizingly close to downloading the data but never quite allow it. This one delivers. The only thing I have not been able to get to work during my review of the resource is the buffer tool.
See this site for additional information about the data layers and services. In addition, you can explore the set of layers on ArcGIS Online in the Marine Cadastre group.
Open Data Sharing for Earth Observations: The Global Earth Observation System of Systems (GEOSS)
Data discover-ability, accessibility, and integration are frequent barriers for scientists and a major obstacle for favorable results on environmental research. To tackle this issue, one that is raised in our book and in this blog, the Group on Earth Observations (GEO) is leading the development of the Global Earth Observation System of Systems (GEOSS), a voluntary effort that connects Earth Observation resources world-wide, acting as a gateway between producers and users of environmental data.
Barbara Ryan, Director, GEO Secretariat, says that, “The primary goal is the assurance of Earth observations so that we can address society’s environmental problems. While many of our activities are targeted toward monitoring global change, we’re actually more concerned about the assurance, continuity, sustainability and interoperability of observing systems, so that monitoring across multiple domains can be done. Governments, research organizations and others actually do the monitoring. We just want to make sure that the assets are in place, and that the data from these monitoring efforts is shared broadly. One of GEO’s primary objectives is to advocate broad, open data sharing, particularly if the data was collected at taxpayer expense—the citizens of the world should have access to that information”
“In this regard, during the first part of GEO, 2004-2009, we looked at the GEO mission as a massive cataloging effort. Then, about two years ago, we changed strategies. We transitioned to a brokering approach whereby interoperability agreements were established with institutions that have datasets and/or databases, rather than us seeking out individual datasets. An example of this approach is illustrated with our agreement with the World Meteorological Organization (WMO). WMO
members have generally registered their data in the WMO Information System (WIS). So we worked on an interoperability arrangement between GEOSS and the WIS resulting in data from one system being discovered by the other system. We are now hearing, particularly from some members in the developing world, that they are getting access to information that they didn’t know existed.”
“WMO members are getting biodiversity and ecosystem information that wouldn’t normally be delivered through the WIS that focuses on weather, climate and water, and GEO members are gaining increased visibility to information in the WIS. It’s a win-win story, and we’d like to have interoperability brokering agreements with any institution that wants its environmental information broadly viewed and accessible throughout the world.”
“Many of the 25 countries that produce 80% of the world’s crops have global forecasting capabilities. GEO is advocating that information from these countries be shared more broadly and openly, and that algorithms be harmonized so that forecasts are improved around the world. Global transparency will help create more stability and a more food-secure world. A related aspect of the security issue is that governments do not want another government having easy access to what is happening over their domain with the fear that this information will be used against them. While this concern is recognized, most of the information that GEO is interested in transcends national boundaries. Atmospheric, oceanic and many terrestrial processes do not respect national boundaries, and actions in one part of the world often have wide-spread consequences. The benefits of broader data sharing almost always outweigh the risks associated with not sharing data.”
These are welcome words to us here as authors of Spatial Reserves and also most likely will be welcome words for the entire geospatial community. I look forward someday soon to be able to search for and use data using the GEOSS.

The Group on Earth Observations (GEO) is leading the development of the Global Earth Observation System of Systems (GEOSS).
Adoption and Advantages of ArcGIS Open Data
According to Esri’s 2014 Open Data year in review, over 763 organizations around the world have joined ArcGIS Open Data, publishing 391 public sites, resulting in 15,848 open data sets shared. These organizations include over 99 cities, 43 countries, and 35 US states. At the beginning of 2015, the organizations represent 390 from North America, 157 from Europe, 121 from Africa, 39 from Asia, and 22 from Oceania. Over 42,000 shapefiles, KML files, and CSV files were downloaded from these sites since July 2014. Recently, we wrote about one of these sites, the Maryland Open Data Portal, in this blog. Another is the set of layers from the city of Launceton, in Tasmania, Australia.
While these initiatives are specifically using one set of methods and tools to share, that of the ArcGIS Open Data, the implications on the data user community are profound: First, the adoption of ArcGIS Open Data increases availability for the entire user community, not just Esri users. This is because of the increased number of portals that result, and also because the data sets shared, such as raster and vector data services, KMLs, shapefiles, and CSVs, are the types of formats that can be consumed by many types of GIS online and desktop tools. Second, as we have expressed in our book and in this blog, while there were noble attempts for 30 years on behalf of regional, national, and international government organizations to establish standards, to share data, and to encourage a climate of sharing, and while many of those attempts were and will continue to be successful, the involvement of private industry (in this case, Esri), nonprofit organizations, and academia will lend an enormous boost to government efforts.
Third, the advent of cloud-based GIS enables these portals to be fairly easily established, curated, and improved. Using the ArcGIS Open Data platform, organizations can leave their data where it is–whether on ArcGIS for Server or in ArcGIS Online–and simply share it as Open Data. Esri uses Koop to transform data into different formats, to access APIs, and to get data ready for discovery and exploration. Organizations add their nodes to the Open Data list and their data can then be accessed, explored, and downloaded in multiple formats without “extraneous exports or transformations.” Specifically, organizations using ArcGIS Open Data first enable the open data capabilities, then specify the groups for open data, then configure their open data site, and then make the site public.
I see one of the chief ways tools like ArcGIS Open Data will advance the open data movement is through the use of tools that are easy to use, and also that will evolve over time. Nobody has an infinite amount of time trying to figure out how to best serve their organization’s data, and then to construct the tools in which to do so. The ability for data-producing organizations to use these common tools and methods represents, I believe, an enormous advantage in the time savings it represents. As more organizations realize and adopt this, all of us in the GIS community, and beyond, will benefit.

ArcGIS Open Data users and information.
Excellent Example of Metadata on a GIS Portal: City of Cambridge
The city of Cambridge, Massachusetts, on the opposite side of the St Charles River from Boston, Massachusetts, USA, is home to over 107,000 people, some prestigious universities such as Harvard and the Massachusetts Institute of Technology, and numerous cultural and physical amenities. The city is exemplary with regards to how it serves spatial data to the GIS community and to the general public. The city’s GIS portal includes a map gallery of traffic, history, watersheds, community development, elections, wireless access, and other themes that are viewable online, downloadable, and many of which are viewable on a mobile device. One unique and interesting mobile map is the “street trees walking app” that allows a person to identify the type of tree species that are nearby as they walk through the streets of Cambridge. The city’s GIS portal includes numerous interactive maps in their CityViewer utility, including a historical viewer dating back to 1947 with imagery and 1865 with maps. GIS data downloads are one of the richest data sets I have seen from any local government, with over 60 layers on infrastructure, public safety, hydrography, topography, health, demographics, and much more.
One of the unique features of the city’s GIS portal is the use of a story map. The story map was created because, in the words of its creators, “The city has all of these great programs and offerings but they aren’t necessarily advertised in the most efficient manner, and the information isn’t always easily accessible.” Besides showing the public where the city services are located, a side benefit for the GIS community is that the story map itself is a thorough and compelling tutorial of how to build your own story map.
Last but not least, the data dictionary for the City of Cambridge GIS is extremely thorough and easy to use, providing shapefiles and file geodatabases. The dictionary contains information on how and why a GIS layer was created, the city’s procedure for maintaining each layer, departments that contribute to the development of each layer, history, and the intended use of the data. The metadata even includes what some dictionaries leave out–a thorough description of the attributes and how the attributes are defined.
In our book, we discuss the costs and benefits of local governments serving their spatial data to the GIS community and to the public. The City of Cambridge has gone to great effort to make their data interesting, relevant, and easy to find and use to a broad spectrum of data users.
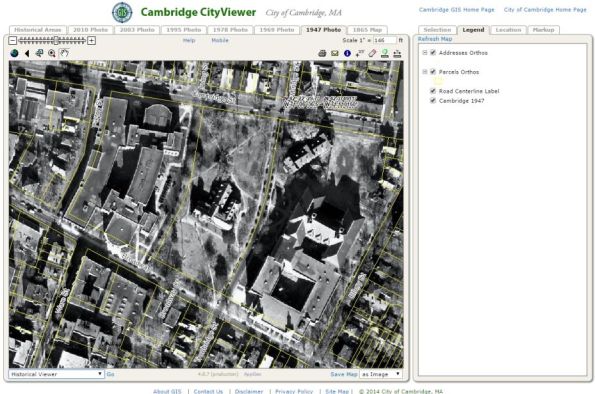
City of Cambridge Map Viewer: 1947 Aerial Photograph with parcels.
Contributors
Gallery


Recent Comments