Know Your Data! Lessons Learned from Mapping Lyme Disease
I have taught numerous workshops using Lyme Disease case counts from 1992 to 1998 by town in the state of Rhode Island. I began with an Excel spreadsheet and used Esri Maps for Office to map and publish the data to ArcGIS Online. The results are shown on this interactive map.
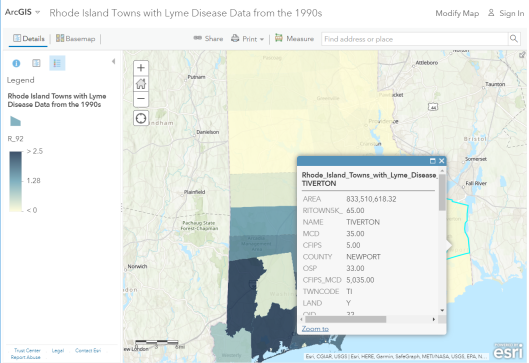
Rhode Island Lyme Disease rates from the 1990s.
As the first decade of the 2000s came to a close, my colleague and I wanted to update the data with information from 1999 to the present, and so we contacted the people at the Rhode Island Department of Health. They not only provided the updated data, for which we were grateful, but they also provided valuable information about the data. This information has wider implications for data quality in general that we frequently discuss on this Spatial Reserves blog.
The Public Health staff told us that the Lyme disease surveillance is time and resource intensive. During the 1980s and 1990s, as funding and human resource capacity allowed, the state ramped up surveillance activities including robust outreach to healthcare providers. Prioritizing Lyme surveillance allowed the state to obtain detailed clinical information for a large number of cases and classify them appropriately. The decrease observed in the 2004-2005 case counts was due to personnel changes and a shift in strategy for Lyme surveillance. Resource and priority changes reduced their active provider follow up. As a result, in the years since 2004, the state has been reporting fewer cases than in the past. They believe this decrease in cases is a result of changes to surveillance activities and not to a change in the incidence of disease in Rhode Island.
If this isn’t the perfect example of “know your data”, I don’t know what is. If one did not know the above information, an erroneous conclusion about the spatial and temporal patterns of Lyme disease would surely have occurred. This kind of information often does not make it into standard metadata forms. This therefore is also a reminder that contacting the data provider is often the most helpful way of obtaining the “inside scoop” on how the data was gathered. See my video highlighting these points. And rest assured that we made certain that this information was included in the metadata when we served this updated information.
–Joseph Kerski
Leave a comment
Contributors
Gallery


Joseph, I am very glad that you are stressing this point. It is very critical and, alas, rather neglected in “GIS education.” My own favorite example comes from many years ago when I was working in South America. A friend invited me to a meeting of local economists one day when the speaker was a PhD candidate from the U.S. who was talking about the complex economic factors that had led to a significant decline in the amount of irrigated land in the country. When he had finished talking about his research, a senior government official commented that the analysis was completely wrong and that there was no decline in the irrigated acreage. The national data was aggregated from reports prepared by individual land owners and, he noted, the decline began at the same time the government let the tax collectors into these annual, individual data reports.
Regretfully, there are a lot more examples of researchers and others making use of databases without any understanding of the potential tripping points in the database.
Thank you Dr Marble, and for sharing the example. In these days of easy-to-create maps it is more critical than ever that we know the inputs from all of those disparate GIS web mapping services that we might be tapping into for a single web map.
–Joseph K
Great local (for me) example of knowing your data and its limitations. I see we’ve both worked with the same co-conspirator/partner-in-crime! Lyn’s the best.
Thanks for reading and commenting!