Testing positional accuracy underwater, revisited
I had the opportunity to test positional accuracy while underwater. Amazingly, I did not even have to get wet! While I was doing some GIS work with the excellent faculty at the University of Hamburg, I walked through the St. Pauli Elbe Tunnel while collecting a track. As I did so, I reflected on the fascinating cultural and physical geography of this 1911 engineering masterpiece that is still in use: The tunnel is 426 m (1,398 ft) long; it was a technical sensation when constructed; photos at the entrance show Kaiser Wilhelm II dedicating it. It connected central Hamburg on the north side of the river with the docks and shipyards on the south side of the River Elbe. The most amazing part was the four massive elevators, capable of carrying bikes and whole vehicles, and of course, 100 years ago, carriages and horses. These elevators and tunnel are still functional and being used today! For more information on this experiment, see my new video on the Our Earth channel here.
While pondering these thoughts, I collected a track in the Runkeeper app, and mapped it as a GPX file in ArcGIS Online as a 2D webmap and as a shapefile in a 3D scene. I wanted to test how spatially accurate a track underwater would be, in the x and y dimensions, but also in the z dimension. First, let’s consider the x and y: As I walked through the tunnel 24 m (80 ft) beneath the surface through one of the two 6 m (20 ft) diameter tubes, I expected the my app to lose sight of the GPS, Wi-Fi, and cell phone towers, but I did not know how far off my position would be. My recent experiments on an above-ground track gave me a ray of hope that perhaps my position would be recorded as somewhere in Germany rather than in the North Sea or the Atlantic Ocean.
I was told by a local source who said that the tunnels are 8 m below the bottom of the river, and the depth of the river is 8 m here as well (this depth here allowed Hamburg to become of the largest container ports in the world). Thus, above me was about 4 meters of airspace, 8 meters of sediment (glacial, in this area), and 8 meters of water for a total of 20 meters above me. The elevation at the water surface here is approximately 5 m above sea level. Thus, my elevation in the tunnel should be 5 – 20 = -15 meters.
My results as a 2D webmap and as a 3D scene are shown below. As is evident, the recorded elevations are all above sea level, at around 4 meters, so they were 15+4=19 meters off of my actual elevation in the tunnel.
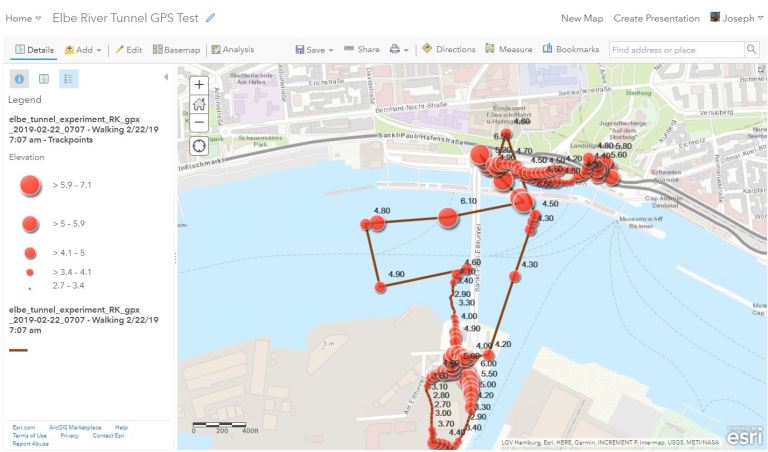 A 2D map in ArcGIS Online showing the results of my experiment, with elevations in meters above sea level shown as labels.
Feel free to open and interact with the data! For example, to test the X and Y: Using the measure tool, measure the distance between the tunnel as shown on the OpenStreetMap basemap and the position recorded by my track. As I left the train station on the north side, my position was fairly accurately recorded, but once I descended the stairs into the tunnel, my position was off to the east by about 140 meters, and then shifted to the west and was off by about 240 meters. But as I continued walking south, for the last 1/3 of my trek through the tunnel, my XY positional accuracy was only off by 50 meters. I ascended the stairs and circled the parking lot on the south side, and was only 1 to 2 meters off once more. I descended into the tunnel and walked north. This time, my position was about 100 meters off, becoming worse as I kept walking. My position overcorrected 80 meters to the north as I ascended the stairs, and “settled back” to being a few meters off as I walked to the train station.
To test the Z position: The elevations were, as I suspected, not displaying their correct number below sea level; that is, 15 meters below sea level. However, you can see that the elevations are actually quite close to the elevation of the surface of the river in this area; at about 4.5 meters.
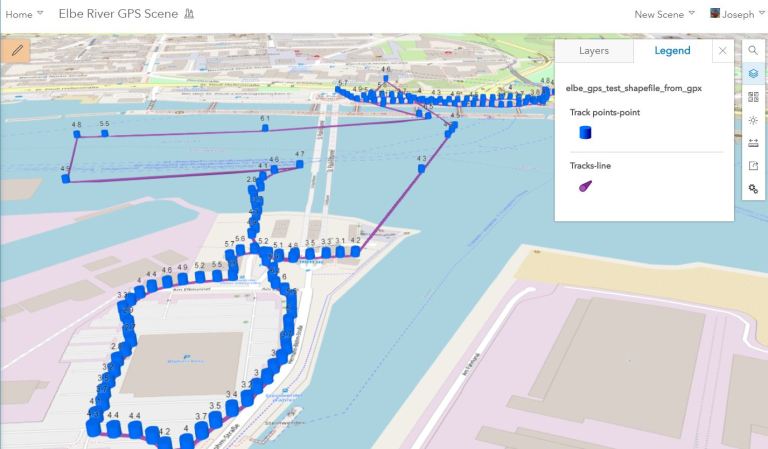 A 3D scene in ArcGIS Online showing the results of my experiment, with elevations in meters above sea level shown as labels and symbolized as cylinders. Feel free to open and interact with this 3D scene!
Overall, with only a smartphone and a fitness app, displaying the data in ArcGIS Online, I was rather pleased with the fact that my positions all around were usually only in the tens or a few dozen meters off of true. This aligns with my recent reports of above-ground experiments and is further evidence of the improvements in spatial accuracy with all location based services.
Interested in further exploration? See the evidence of my field trip in the photographs below.
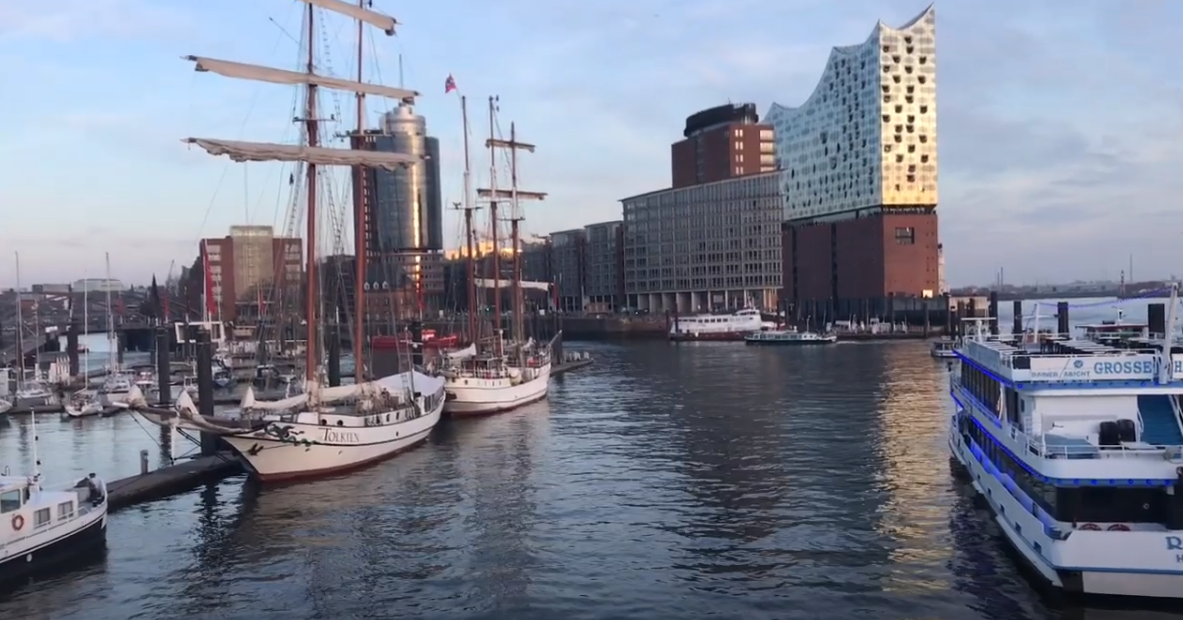
The Elbe River as it appears near the tunnel.
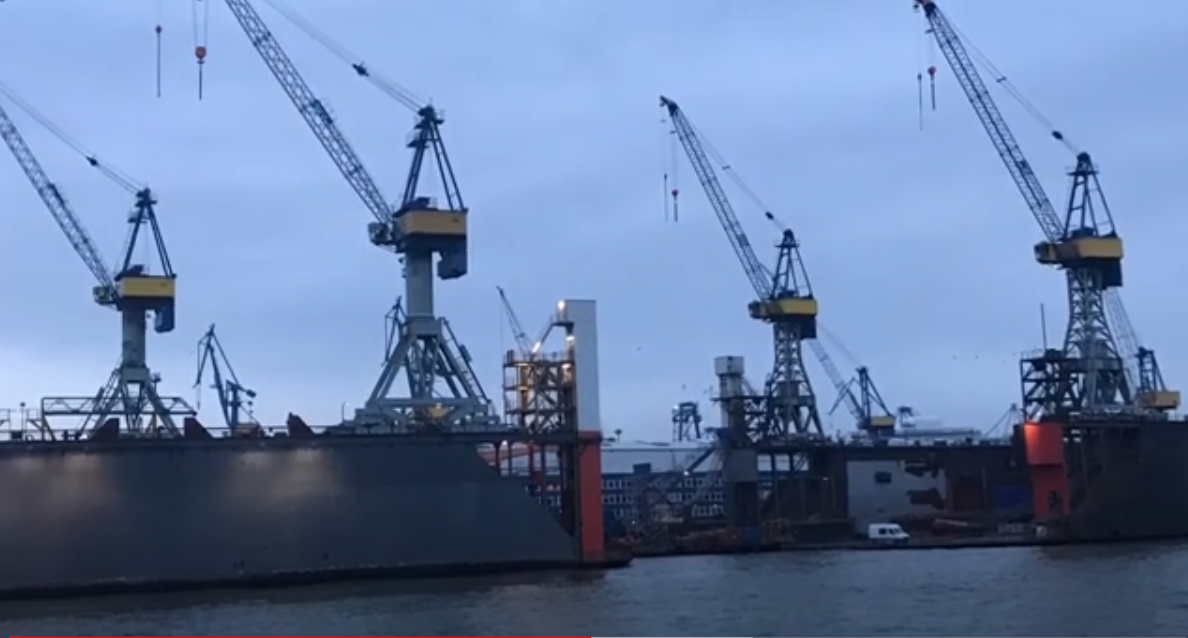
Part of the enormous container port on the south bank of the Elbe.
 The very large elevators that carry pedestrians, bicycles, and even vehicles from the street level to the level of the tunnels. This one is at the north side of the river with a photo of the opening ceremony with Kaiser Wilhelm II dedicating it.

Standing at the entrance to the tunnel; this photo also shows a few of the glazed terra cotta art sculptures on the left, and in the distance on the right.
Now, go conduct your own accuracy experiments!
–Joseph Kerski
Leave a comment
Contributors
Gallery


Thanks for showing the great connection of what we do and how it can connect with GIS . I enjoyed my tour at your cost.
Thank you.