Archive
Crowdsourcing Story Maps and Privacy
As we have pointed out in this blog, we have had the capability to create story maps (multimedia-rich, live web maps) for a few years now, and we have also had the capability to collect data via crowdsourcing and citizen science methods using a variety of methods. But now the capability exists for both to be used at the same time–one way is with the new crowdsourcing story map app from Esri.
The crowdsource story map app joins the other story map apps that are listed here. To get familiar with this new app, read this explanation. Also, you might explore a new crowdsourced story map that, after selecting “+ Participate”, prompts you for your location, photograph, and a sentence or two about attending, in this case, the Esri User Conference. If you did not attend, examining the application will give you a good sense for what this new app can do.
It’s not just this story map that has me interested. It is that this long-awaited capability is now at our fingertips, where you can, with this same app, create crowdsourced story maps for gathering data on such things as tree cover, historic buildings, noisy places, litter, weird architecture, or something else, on your campus or in your community. It is in beta, but feel free to give this crowdsourcing story map app a try.
We have also discussed location privacy concerns both here and in our book. The story Map Crowdsource app is different from the other Story Maps apps in that it enables people to post pictures and information onto your map without logging in to your ArcGIS Online organization. Thus, the author does not have complete control over what content appears in a Crowdsource story. Furthermore, the contributor’s current location, such as their current street address or locations they have visited, can be exposed in a Crowdsource app and appear with their post in these maps as a point location and as text. This may be fine if your map is collecting contributions about water quality, invasive plant species, or interesting places to visit in a city, where these location are public places. But it may not be desirable for other subject matter or scenarios, especially if people may be posting from their own residence.
Thus, it is up to you as the author of a Story Map Crowdsource app to ensure that your application complies with the privacy and data collection policies and standards of your organization, your community, and your intended audience. You might wish to set up a limited pilot or internal test of any Story Map Crowdsource project before deploying and promoting it publicly in order to review if it meets those requirements. And for you as a user of these maps, make sure that you are aware that you are potentially exposing the location of your residence or workplace, and make adjustments accordingly (generalizing your location to somewhere else in your city, for example) if exposing these locations are of concern to you).
Thus, the new crowdsource story map app is an excellent example of both citizen science and location privacy.
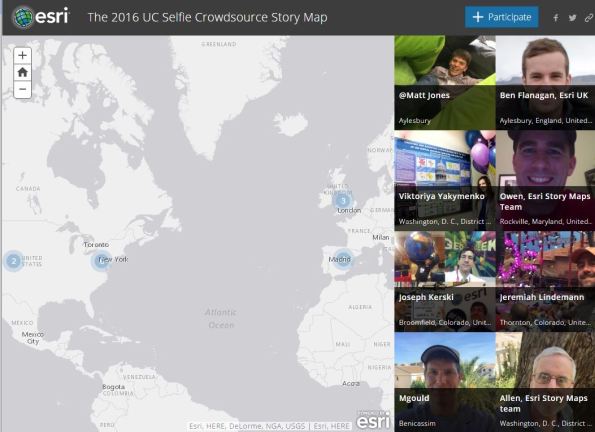
Example of the new crowdsourcing story map app.
US Census Business Builder App and the Opportunity Project
The Census Business Builder app and the Opportunity Project are two new tools from the US Census Bureau that make accessing and using data, and, we hope, making decisions from it, easier for the data analyst. Both of these applications are good representatives of the trend we noted in our book and in this blog— the effort by government agencies to make their data more user-friendly. While I would still like to see the Census Bureau address what I consider to be the still-cumbersome process of downloading and merging data from the American Community Survey and the Decennial Census with the TIGER GIS files, these two efforts represent a significant step in the right direction. While GIS users may still not be fully satisfied by these tools, the tools should expand the use of demographic, community, and business data by non-GIS users, which seems to be sites’ goal.
The Opportunity Project uses open data from the Census Bureau and from communities along with a Software Development Kit (SDK) to place information in the hands of decision makers. Because these decision makers are not likely to be familiar with how to conduct spatial analysis within a GIS, the appeal of this effort is for wiser decision making with the geographic perspective. A variety of projects are already on the site to spark ideas, including Streetwyze, GreatSchools, and Transit Analyst.
The Census Business Builder is a set of web based mapping services that provides selected demographic and economic data from the Census Bureau. You can use it to create customized maps and county and city level reports and charts. A small business edition presents data for a single type of business and geography at a time, while the regional analyst edition presents data for all sectors of the economy and for one or more counties at a time. These tools are based on Esri’s online mapping capabilities and offer some of the functionality of Esri’s Business Analyst Online. Give them a try and we look forward to your comments below.
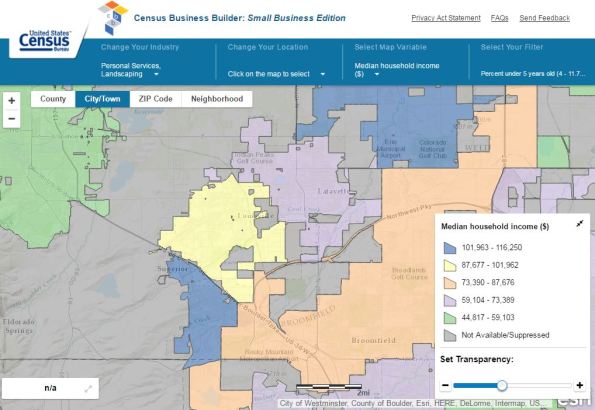
A map that I created using the Census Business Builder.
Landsat Thematic Bands Web Mapping Application in ArcGIS Online
Teaching remote sensing? Or just want to understand remotely sensed imagery better? The Landsat Thematic Bands web mapping application can serve as a very useful teaching, learning, and research tool (June 2020 update: The application is now part of the ArcGIS Living Atlas of the World set of apps). It covers the entire planet and the map is updated daily with new Landsat 8 scenes.
You can access many band combinations and indices by hovering over the tools to the left of the map image and selecting among the following:
- Agriculture: Highlights agriculture in bright green. Bands 6,5,2
- Natural Color: Sharpened with 25m panchromatic band. Bands 4,3,2+8
- Color Infrared: Healthy vegetation is bright red. Bands 5,4,3
- SWIR (Short Wave Infrared): Highlights rock formations. Bands 7,6,4
- Geology: Highlights geologic features. Bands 7,4,2
- Bathymetric: Highlights underwater features. Bands 4,3,1
- Panchromatic: Panchromatic image at 15m. Band 8
- Vegetation Index: Normalized Difference Vegetation Index (NDVI). (Band5-Band4)/(Band5+Band4)
- Moisture Index: Normalized Difference Moisture Index (NDMI). (Band5-Band6)/(Band5+Band6)
The Time tool for different indices at larger scales based on a user-selected location enables examination of changes over years or over seasons. It also provides temporal profiles for NDVI (Normalized Difference Vegetation Index), NDMI (Normalized Difference Moisture Index) and an Urban Index, dating back to 1973. The Identify tool enables access to information on the date, cloud cover, and a spectral profile about each scene. The Bookmark tool allows access to interesting locations such as the “Eye of the Sahara” in Mauritania.
The original application was written using Web AppBuilder for ArcGIS accessing image services using the ArcGIS API for JavaScript, with access to the following Image Services:
- Landsat Multispectral on AWS – 8-band multispectral 30m resolution image services and functions that provide different band combinations and indices.
- Landsat Pan-sharpened on AWS – Panchromatic-sharpened imagery; 4-band (Red, Green, Blue and NIR); 30m resolution.
- Landsat Panchromatic on AWS – Panchromatic imagery; 15m resolution.
These services can also be accessed through the public Landsat on AWS group on ArcGIS Online. Because you can add these services as layers to your own maps or are adding to maps made by others, or if you are simply using the above web mapping application as a standalone map, you truly have “the world at your fingertips” with these maps and apps. But there is a third option: Use the Unlock Earth’s Secrets page, also useful for instruction, with the above application embedded in it, but also with explanatory text and featured places around the planet as they have changed through time.
Think of the above as solid introductory segments to help your students, customers, or stakeholders see the value in remote sensing. These maps and applications require very little geospatial technology skills to use, but allow you to focus on building remote sensing concepts and principles while exploring some truly engaging content and places.
To dig deeper, delve into the many powerful remote sensing functions available in ArcGIS Desktop. One source for engaging, hands-on activities, is Kathryn Keranen and Bob Kolvoord’s book Making Spatial Decisions Using GIS and Remote Sensing: A Workbook.
Give these resources a try!

Landsat web application in ArcGIS Online.
Contributors
Gallery


Recent Comments